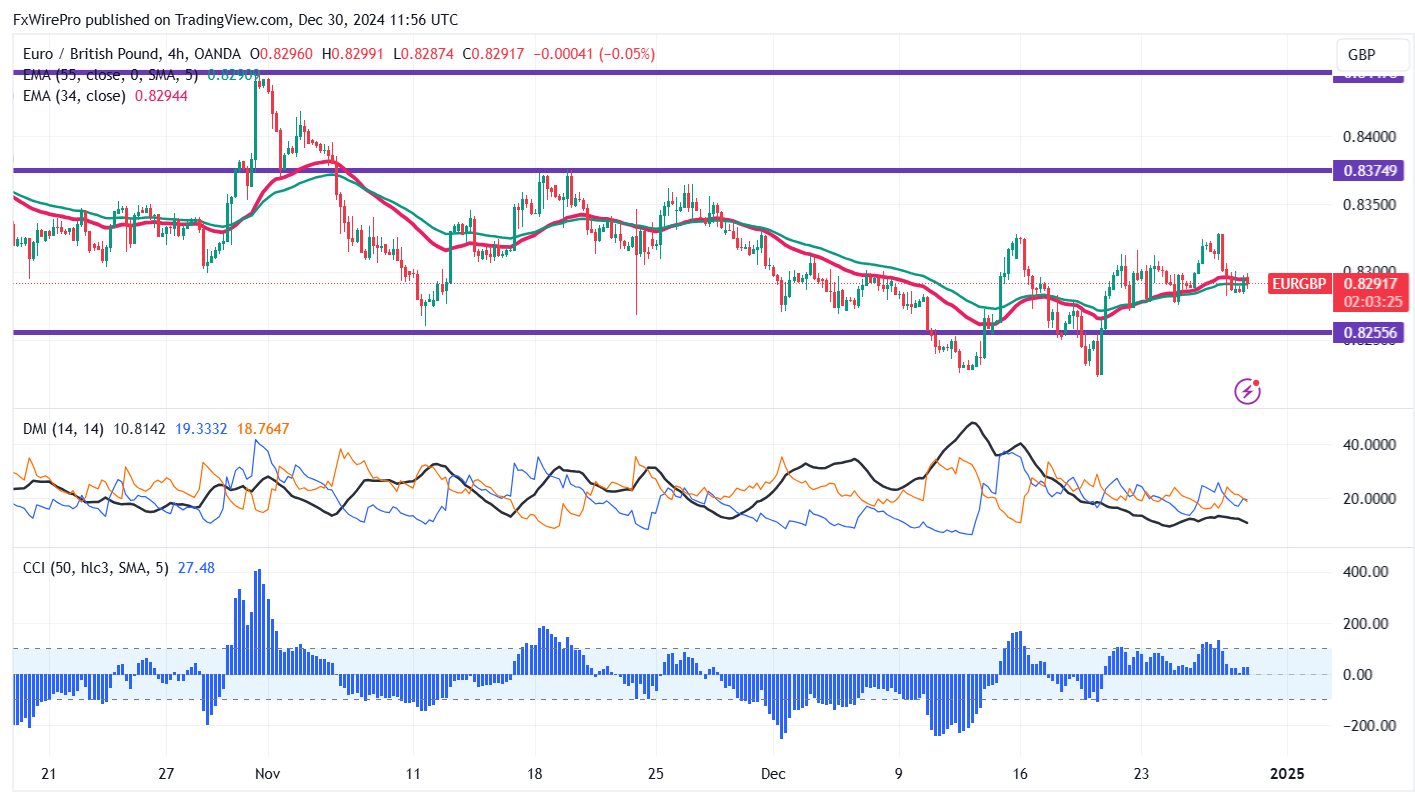
EURGBP pared some of its gains on the strong pound sterling. Intraday bias remains bullish as long as support 0.8220 holds. It hit a low of 0.82822 yesterday and is currently trading around 0.82904.
Technical Analysis
The pair is currently trading above the 34- and 55-EMA on the 4-hour chart.
- Bearish Trend Confirmation: If the price stays below 0.8260, it will confirm an intraday bearish trend. A drop to 0.8220/0.8190 is likely.
- Near-Term Resistance: Current resistance is around 0.8325. If it breaks above, we could see movement toward 0.8340/0.8360/0.8380/0.845/0.8500. The bearish outlook would be invalidated only if the price goes above 0.8500.
Indicator Analysis (4-hour chart)
- CCI (50): Bullish
- Average Directional Movement Index: Neutral
Trading Recommendation
It may be wise to buy on dips around 0.8280, with a stop loss set at 0.8220 and a target price of 0.8435.
FxWirePro- EURGBP Trade Idea
EURGBP trades slightly higher on strong Euro.. Intraday bias remains bullish as long as support 0.8220 holds. It hits a high of 0.83286 at the time of writing and is currently trading around 0.83098.
The monetary policy differences between the Bank of England (BOE) and the European Central Bank (ECB) have become more noticeable recently due to varying economic conditions. As of May 2024, the BOE has kept its interest rate at 5.25%, with some members suggesting potential cuts later if inflation decreases. The UK’s core inflation is at 4.2%, leading to a cautious outlook. In contrast, the ECB cut its key interest rate to 3.00% in December 2024, responding to a better inflation outlook and supporting economic growth. The ECB expects inflation to average 2.4% in 2024, allowing for a more flexible monetary policy compared to the BOE.
Technical Analysis
The pair is currently trading above the 34- and 55-EMA on the 4-hour chart.
- Bearish Trend Confirmation: If the price stays below 0.8260, it will confirm an intraday bearish trend. A drop to 0.8220/0.8190 is likely.
- Near-Term Resistance: Current resistance is around 0.8325. If it breaks above, we could see movement toward 0.8340/0.8360/0.8380/0.845/0.8500. The bearish outlook would be invalidated only if the price goes above 0.8500.
Indicator Analysis (4-hour chart)
- CCI (50): Bullish
- Average Directional Movement Index: Neutral
Trading Recommendation
It may be wise to buy on dips around 0.8280, with a stop loss set at 0.8220 and a target price of 0.8435.


