Technicals

Add as a preferred source on Google

FxWirePro: EURUSD (Chart of the day)

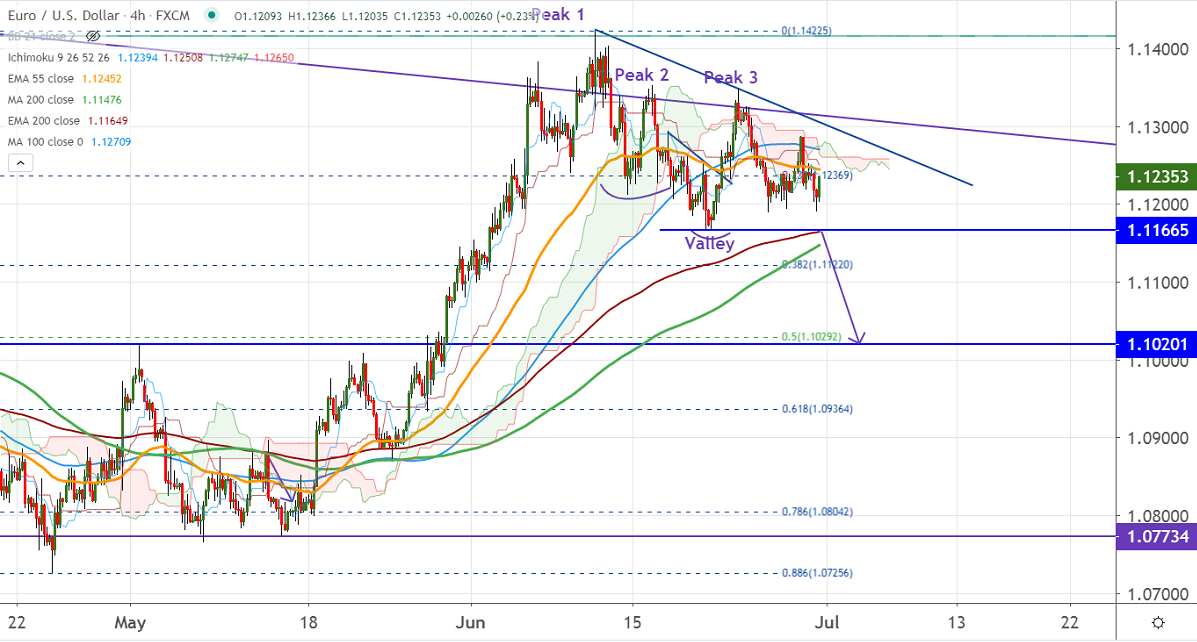
Chart pattern- Lower high and higher low The pair has formed first high at 1.14225 (Jun 10th, 2020), second high at 1.3534 (Jun 16th, 2020), and 3rd high at 1.13484 (Jun 23 rd 2020). It hits low of 1.11683 on Jun 19th an…

1 min read
FxWirePro: EURUSD (Chart of the day)
Image from the original EconoTimes article

Read the original article

Chart pattern- Lower high and higher low


The pair has formed first high at 1.14225 (Jun 10th, 2020), second high at 1.3534 (Jun 16th, 2020), and 3rd high at 1.13484 (Jun 23 rd 2020). It hits low of 1.11683 on Jun 19th and is hovering near 1.1200 level.

On the lower side, violation below 1.11683 confirms bearish continuation, a dip till 1.1100/1.10292 (50% fib of 1.06359 and 1.14225).

The near term resistance is at 1.1290 and the violation above targets 1.1350/1.1400.The minor trend reversal only above 1.14225.


It is good to sell below 1.11680 with SL around 1.1200 for the TP of 1.10300.   

Related articles

View all
Technicals

Major Pair Currency Score: AUDUSD Bearish

EURUSD - Levels to watch - 1.100 GBPUSD Levels to watch - 1.3180 USDCHF Levels to watch - 0.8400 USDCAD - Levels to watch - 1.4300 AUDUSD - Levels to watch - 0.7000 NZDUSD - Levels to watch - 0.5560

