
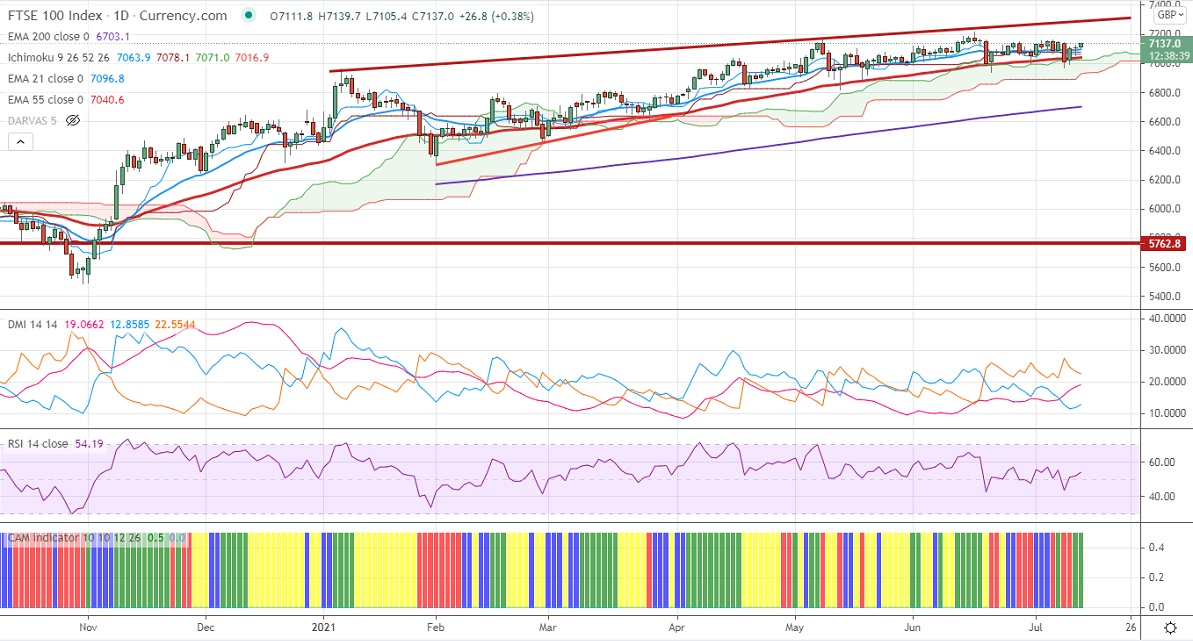
Ichimoku Analysis (Daily chart)
Tenken-Sen- 7063
Kijun-Sen-7078
FTSE100 is trading in a narrow range between 6940 and 7161.50 for the past two weeks. The United Kingdom has reported more than 35000 infections on Friday, the highest in over five months. The retail sales surged by 13.1% in June, against a decline of 1.3% in June 2019. The US indices edged higher ahead of bank earnings. FTSE100 should break above channel resistance 7275 for further bullishness. The FTSE100 hits an intraday high of 7139 and currently trading around 7131.90.
The near-term resistance to be watched is 7165; any break above will take the index till 7200/7240/7275. On the lower side, near-term support is around 7050, and any violation below targets 7000/6940/6900/6820.
Indicator (Daily chart)
CAM indicator – Bullish
Directional movement index – Bearish
It is good to buy on dips around 7050 with SL around 6940 for the TP of 7215.


