


 FxWirePro: EUR/AUD under pressure as key support gives way
  FxWirePro- Major Crypto levels and bias summary
  FxWirePro: GBP/NZD up trend gains some momentum but hurdles ahead
  Ethereum Consolidates: Bullish Technicals Point to a Potential $3,000 Breakout
  FxWirePro:NZD/USD uptrend loses momentum but bullish setup remains
  FxWirePro- Woodies Pivot(Major)
  FxWirePro: USD/CAD extends decline on broad dollar weakness
  FxWirePro- Major Pair levels and bias summary
  NZDJPY Bulls Charge Toward 95.00: Safe-Haven Exodus Drives Kiwi Rally
  FxWirePro: USD/JPY holding bid into weekend
  FxWirePro: GBP/AUD gains some upside momentum but still bearish
  FxWirePro: USD/ZAR edges lower ,investors remain on edge
  FxWirePro: USD/ZAR recovers slightly but trend is still bearish
  FxWirePro: GBP/USD bulls remain cautiously optimistic
  FxWirePro: EUR/AUD downtrend loses steam but outlook still bearish


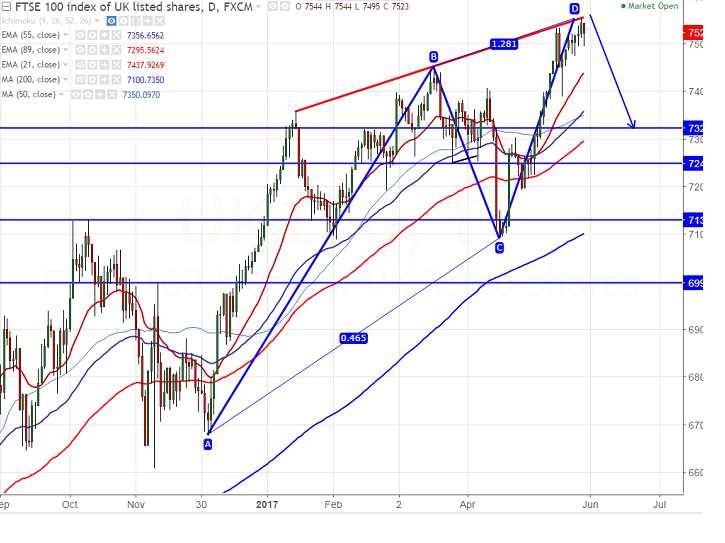
- Pattern formed – Bearish AB=CD.
- Potential Reversal Zone (PPRZ) - 7560 (trend line joining 7359 and 7445).
- FTSE100 shown a major jump after hitting low of 7092 on Apr 20th 2017. The index is struggling to close above 7500 psychological resistance and any bullish continuation can be seen only above that level.
- In the daily chart the index has formed bearish AB=CD pattern and any further bullish continuation can be seen only above 7565. Any break above will take the index till 7625 (161.8% retracement of 7534 and 7389)/7663 (161.8% retracement of 7445 and 7092).
- On the lower side, near term support is around 7429 (21 day EMA) and any break below will drag the index down till 7389 (May 18th 2017)/7350 (55 EMA)/7290 (89 – EMA).
It is good to sell on rallies around 7520-7525 with SL around 7570 for the TP of 7390/7350.


