


 FxWirePro- Major Pair levels and bias summary
  FxWirePro- Major Crypto levels and bias summary
  AUD/JPY Slips Below 112 as BOJ Intervention Sparks Bearish Momentum: Sell the Rallies
  FxWirePro: GBP/AUD drifts lower after BOE rate decision
  Major FX Action Bias & US Market Sentiment: NZD/USD (Extremely Bullish) & AUD/USD (Bullish) Watchlist
  FxWirePro: GBP/USD rises as soft US data pressures dollar
  FxWirePro- Woodies pivot (Major)
  FxWirePro- Major Crypto levels and bias summary
  FxWirePro: NZD/USD consolidates overnight gains, but loses momentum
  FxWirePro: GBP/NZD remains weak, eyes 38.2%fib support
  FxWirePro- Major Pair levels and bias summary
  Nikkei Surges Past 65,000 on Suspected Yen Weakness: Tech Giants Like Advantest and NEC Lead Explosive Gains
  US Magnificent 7 Stocks Trend Score: Amazon & Microsoft Hit Extreme Bullish (+100) as Meta Drops to -100 — Key Resistance & Support Watchlist
  US Magnificent 7 Stocks Trend Score: Amazon & Microsoft Hit Extreme Bullish (+100) as Meta Drops to -100 — Key Resistance & Support Watchlist
  Major European Indices Score Extremely Bullish: DAX Eyes 26000, CAC Targets 8600, FTSE100 at 11000 – Key Levels to Watch
  AUDJPY Volatile After Massive Sell-Off: Sell Rallies at 113, Targeting 110 as Bearish Momentum Surges


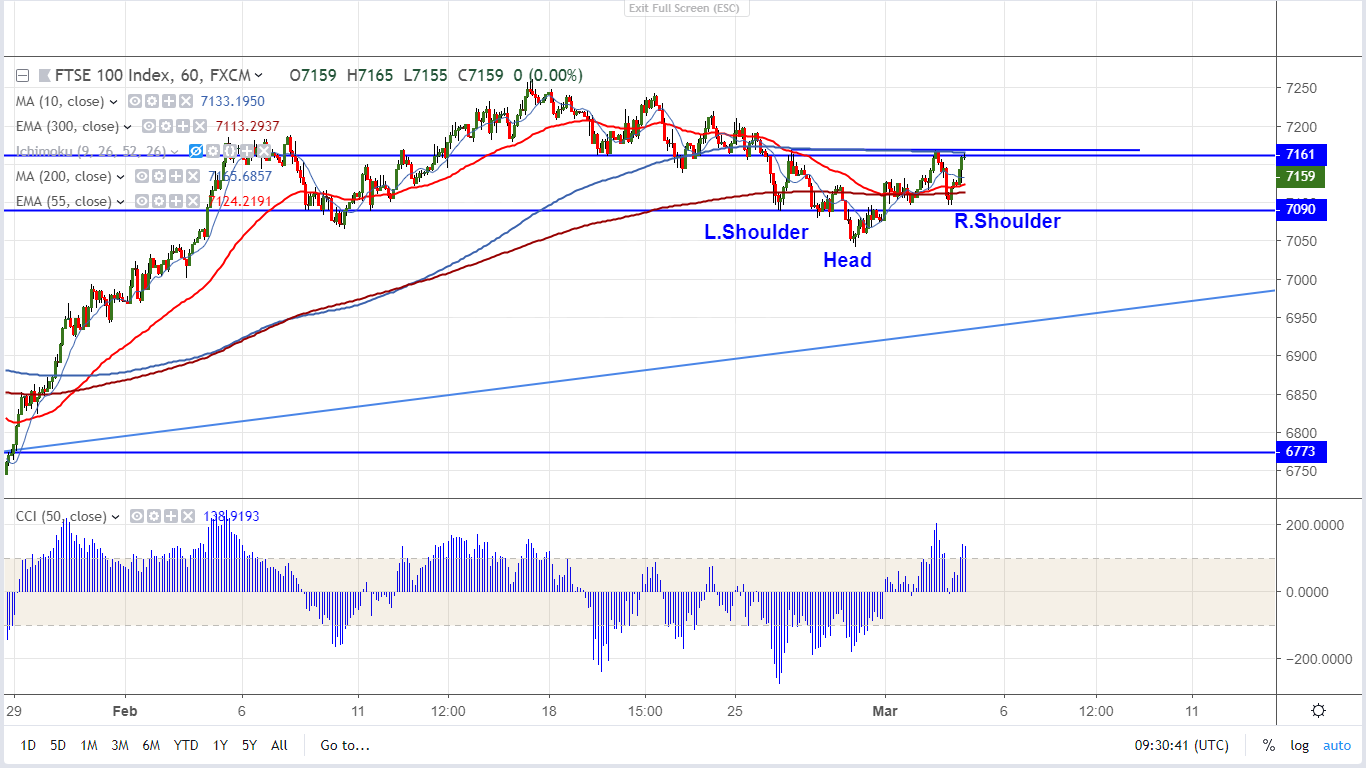
Chart pattern- Inverse head and Shoulder pattern
FTSE100 has once again recovered after declining slightly below 7100 level. The index hits low of 7097 yesterday and jumped till 7153.The index was trading weak and lost more than 3% after forming temporary top around 7262. The decline in GBP is supporting FTSE100 index currently and it has lost nearly 200 pips after forming temporary top around 1.3350.FTSE100 is currently trading around 7151.
On the higher side, the index is facing strong resistance around 7165-69 (200-H MA) and any break above this confirms minor bullishness and a jump till 7176/7215. The index should break above 7262 for further bullishness.
The near term support is around 7096 and any violation below targets 7065/7042. Any break below 7046 (300- 4 H EMA) confirms further bearishness.
It is good to buy on dips around 7135-40 with SL around 7095 for the TP of 7215/7262.


