


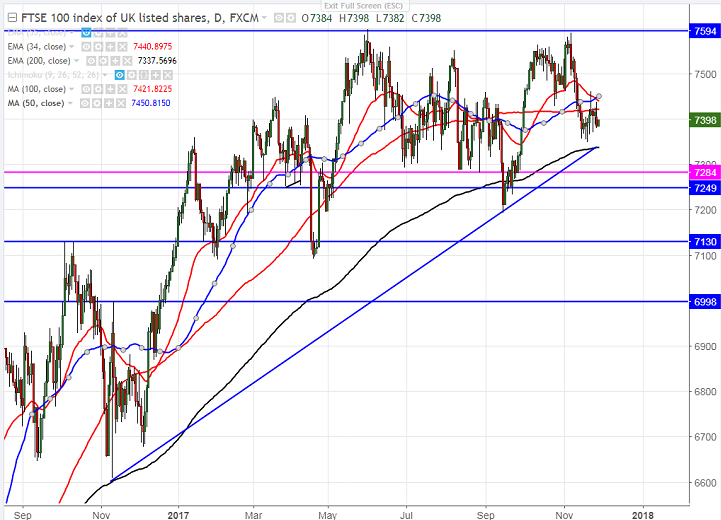
- Chart pattern – Double top
- FTSE100 has formed a temporary top near 7600 and started to decline sharply from that level. The index dipped till 7348 and is currently trading around 7384.
- The index’s short term support is around 7347-7336 (61.8% retracement of 7193 and 7590 and 200- day EMA) and any break below will drag the index down till 7282/7193. Any convincing break below 7190 confirms long term trend reversal, a decline till 7000 is likely.
- The near term resistance is around 7498 (61.8% retracement of 7590 and 7348) and any break above will take the index till 7550/7600.
- Overall bullish continuation only above 7600.
It is good to sell on rallies around 7425-7435 with SL around 7500 for the TP of 7335/7195.


