
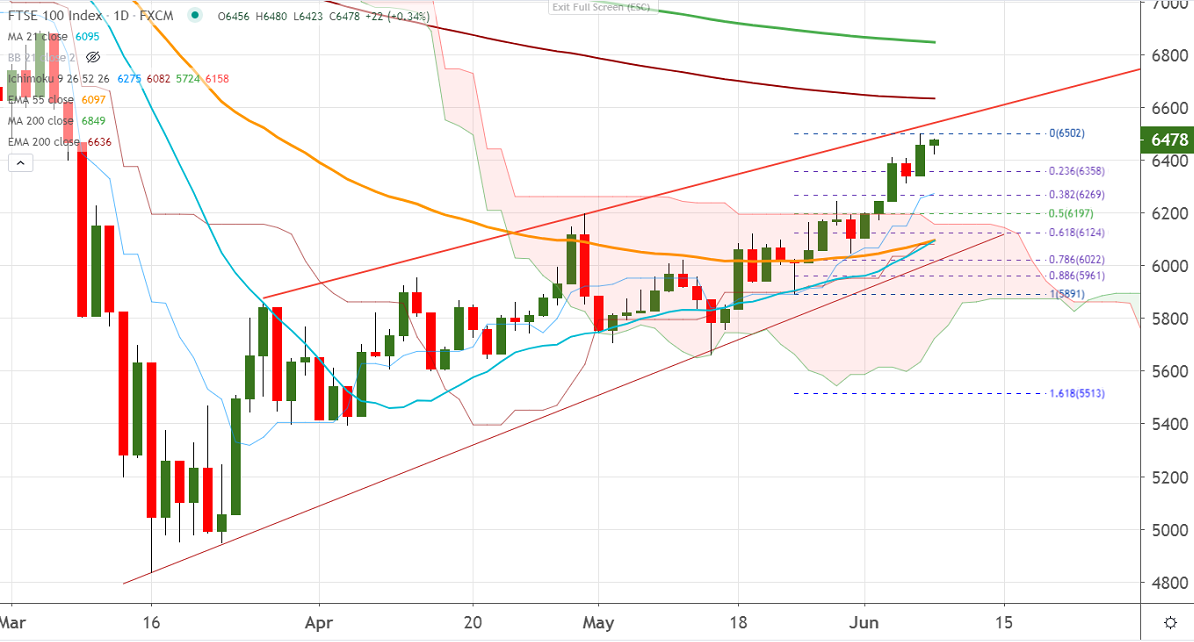
Ichimoku Analysis (Daily chart)
Tenken-Sen- 6257
Kijun-Sen- 6082
FTSE100 is trading flat after 5 days of rally and is currently trading around 6460. The index was one of the best performers the previous week and surged more than 6% on a strong global stock market. The opening up of economies and better than expected U.S jobs data pushed NASDAQ to an all-time high. The UK index hits a high of 6502 and is currently trading around 6467.
The near-term resistance to be watched is 6550 (trend line joining 5863 and 6197), and any violation above will take the index till 6637 (200-day EMA)/6700. Significant trend continuation only if it crosses 6853.
The immediate support is around 6365 (100-day MA), indicative violation below targets 6300/6269/6200. Bearish continuation only if it breaks below 6200.
It is good to sell on rallies around 6515-20 with SL around 6570 for the TP of 6369/6300.


