


 AI Memory Boom Sparks Global Chip Supply Crunch
  How Donald Trump has changed the way diplomacy is done
  Gold Surges Above Key EMAs, Bulls Eye Resistance Amidst Bullish Momentum
  Trump’s Iran Strategy: What Has Been Achieved After Three Months of Conflict?
  Gold's 365-Day EMA Streak Since Oct 2023 Faces Its First Real Test at $3,980 — Break or Bounce to $4,140?
  China’s AI Manufacturing Boom Masks Weak Consumer Economy, Citi Says
  J.P. Morgan Sees Potential Vestas Guidance Upgrade Amid Strong Wind Energy Demand
  Bank Regulation Rollbacks in the U.S. and UK Could Increase Financial Risks, Study Warns
  SpaceX Stock Gets $175 Target as Analysts See Massive Growth Ahead
  Sell the Bounce": Gold Rally Stalls Near $4165 as Fed Hawks Slam the Door on Rate Cuts — Targets $4000/$3600


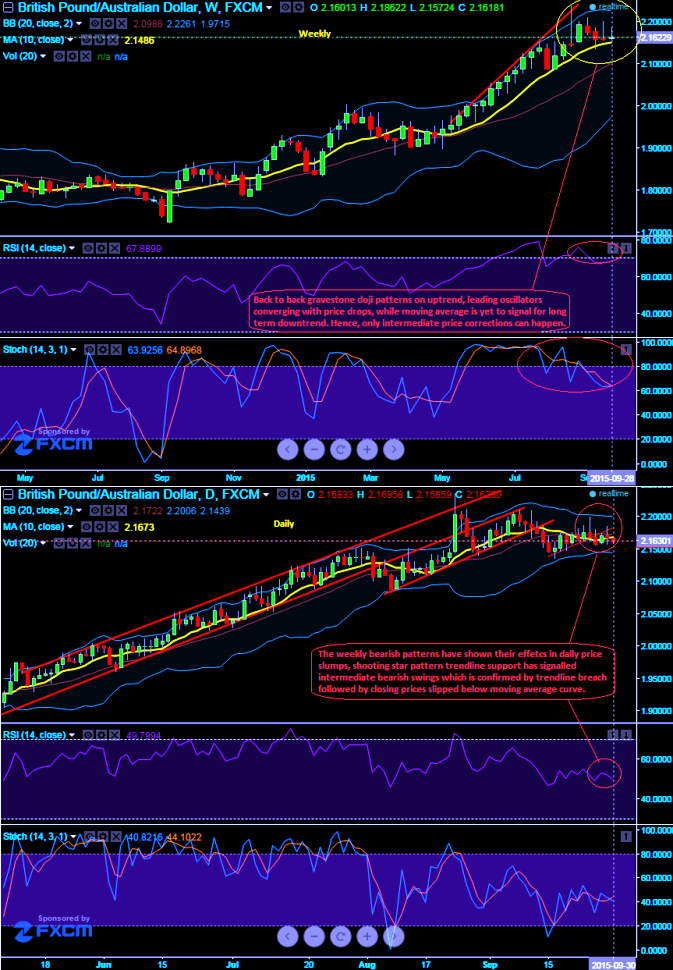
While we were designing long term hedging framework 14 week RSI was used with an objective to track price momentum over medium to long term perspectives. We traced back to back "Gravestone Doji" patterns on these charts at the peaks of uptrend which is now factoring their effects on daily charts. It was found in the last month at 2.1458 levels firstly, we again found the same pattern in last week at 2.1586 levels on a trendline breach.
The strength index curve approached 80 levels (i.e. overbought territory) and it was moving in convergence with dipping prices which signals selling momentum is intensifying. While %D crossover is also signifies the selling pressure at current levels.
Moving onto daily charts, here we again found an intimacy in the trend that suggested by weekly charts as shooting star here again on the trendline support at around 2.1685 levels has factored in daily prices. Current spot FX is ticking at 2.1624 which means almost 60 pips drop from shooting star formation. Overall, we would foresee an intermediate price correction in this pair.
For a swing trader it is all too easy to be carried away by a market that apparently knows no bounds. While slow stochastic on the other hand has neither remained in overbought nor oversold territory and it is signifying slight indecision.

- News

- Economy

- Central Banks
- Investing
- Research
- Roundups
- Digital Currency
- Insights
- Technical Analysis
- Technology
- Business
- Law
- Health
- Nature
- Fintech
- Science
- Topic
- Opinions
- ©Econometrics LLC . All Rights Reserved.
FxWirePro: GBP/AUD weekly doji’s signal bears to take over intermediate trend
Wednesday, September 30, 2015 8:32 AM UTC
Editor's Picks


- Market Data
Most Popular


