


 FxWirePro: USD/JPY eases ahead of Fed decision , Intervention risks linger
  NZDJPY Pullback: Sell Rallies Toward 93.30 as Yen Weakness Eases
  Major Pairs Action Bias: USDCAD and USDCHF Stand Out as Extremely Bullish While GBPUSD and NZDUSD Turn Extremely Bearish
  EUR/JPY Holds Bullish Bias as Euro Extends Recovery
  FxWirePro: GBP/AUD gains some upside momentum but still bearish
  Crypto Action Bias: ETHUSD Stands Out as the Bullish Pair to Watch
  FxWirePro: NZD/USD neutral in the near-term, scope for downward resumption
  FxWirePro: USD/ZAR retreats but trend is still bullish
  JPY Action Bias: USDJPY Emerges as the Clear Bullish Pair to Watch Amid Mixed Crosses
  FxWirePro: USD/CAD runs out of steam but maintains bullish outlook
  FxWirePro: GBP/NZD maintains bersish bias with focus on 2.2900 level
  FxWirePro- Major Pair levels and bias summary
  FxWirePro: GBP/USD edges higher as traders await BoE guidance and UK fiscal clarity
  JPY Pairs Action Bias: EURJPY Leads as Bullish Standout Amid Mixed Momentum
  FxWirePro: AUD/USD falls after softer-than-expected Australian Q2 CPI
  FxWirePro: GBP/AUD downside pressure builds, key support level in focus


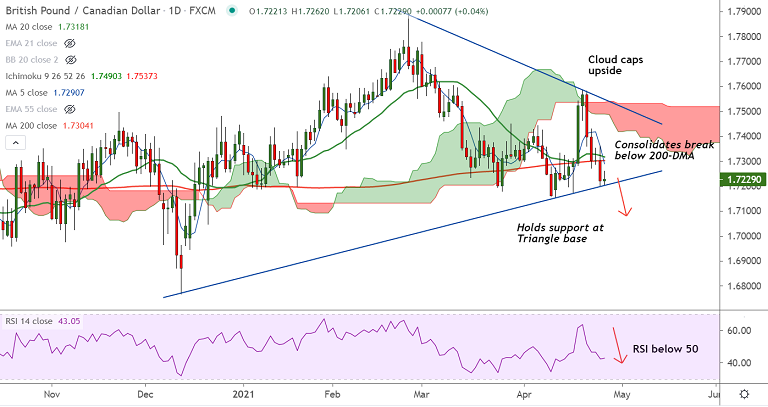
GBP/CAD chart - Trading View
Technical Analysis: Bias turning bearish
- GBP/CAD was trading 0.12% higher on the day at 1.7241 at around 13:00 GMT
- Price action was consolidating break below 200-DMA
- Gravestone Doji formation on the previous week's candle dents upside
- Oscillators are bearishly aligned, Stochs and RSI are biased lower and RSI is below the 50 mark
- MACD is on verge of bearish crossover on signal line, 5-DMA has confirmed a bearish crossover on 20-DMA
- -ve DMI dominance adds to the bearish bias
Support levels - 1.7205 (Triangle base), 1.7199 (110W EMA), 1.7091 (200W MA)
Resistance levels - 1.7292 (5-DMA), 1.7304 (200-DMA), 1.7356 (200H MA)
Summary: GBP/CAD is currently holding support at Symmetric Triangle base at 1.7205. Breach below will drag prices lower. Scope for test of 200W MA at 1.7091.


