


 FxWirePro- Woodies pivot (Major)
  FxWirePro: GBP/AUD downside pressure builds, key support level in focus
  JPY Action Bias: USDJPY Emerges as the Clear Bullish Pair to Watch Amid Mixed Crosses
  FxWirePro: USD/ZAR retreats but trend is still bullish
  FxWirePro: USD/CAD runs out of steam but maintains bullish outlook
  FxWirePro: EUR/NZD up trend gains momentum but hurdles ahead
  FxWirePro: USD/ CNY remains soft ahead of Fed decision
  FxWirePro: GBP/NZD maintains bersish bias with focus on 2.2900 level
  FxWirePro: NZD/USD edges lower, remains on back foot
  AUDJPY Weakness Deepens: Sell Rallies Toward 112 as Aussie Dollar Falters
  FxWirePro: USD/JPY eases ahead of Fed decision , Intervention risks linger
  FxWirePro: EUR/AUD outlook weaker on renewed downside pressure
  FxWirePro: AUD/USD dips after RBA Governor speech
  FxWirePro: AUD/USD falls after softer-than-expected Australian Q2 CPI
  FxWirePro- Major Pair levels and bias summary
  Major Pairs Action Bias: USDCAD and USDCHF Stand Out as Extremely Bullish While GBPUSD and NZDUSD Turn Extremely Bearish


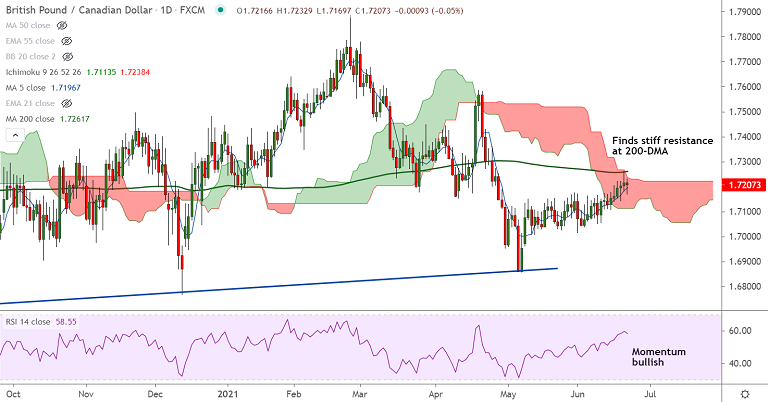
GBP/CAD chart - Trading View
Technical Analysis: Bias Bullish
- GBP/CAD was trading largely unchanged at 1.7215 at around 13:25 GMT
- The pair has paused upside at 200-DMA which is offering stiff resistance at 1.7261
- Price action is holding above 200H MA which is supporting pullbacks in the pair
- Momentum studies are bullish and volatility is rising as evidenced by widening Bollinger bands
- Decisive break above 200-DMA and daily cloud will propel the pair higher
Support levels - 1.7198 (5-DMA), 1.7173 (55-EMA), 1.7146 (21-EMA)
Resistance levels - 1.7226 (110-EMA), 1.7261 (200-DMA), 1.7293 (20-month MA)
Summary: GBP/CAD has paused upside at 200-DMA. Technical studies support upside. Decisive break above 200-DMA will propel the pair higher.


