


 Major Pairs Action Bias: USDCAD and USDCHF Stand Out as Extremely Bullish While GBPUSD and NZDUSD Turn Extremely Bearish
  FxWirePro- Woodies pivot (Major)
  FxWirePro: NZD/USD neutral in the near-term, scope for downward resumption
  FxWirePro: EUR/ AUD gains some ground , but remains on bearish path
  NZD/JPY Flatlines Near 94.60: Will Key Support Reignite the Uptrend?
  FxWirePro- Major Pair levels and bias summary
  FxWirePro: AUD/USD dips after RBA Governor speech
  FxWirePro: EUR/NZD up trend gains momentum but hurdles ahead
  EUR/JPY Holds Bullish Bias as Euro Extends Recovery
  FxWirePro: GBP/AUD downside pressure builds, key support level in focus
  JPY Pairs Action Bias: EURJPY Leads as Bullish Standout Amid Mixed Momentum
  Major Forex Pairs Action Bias: GBPUSD and AUDUSD Turn Extremely Bearish
  NZDJPY Pullback: Sell Rallies Toward 93.30 as Yen Weakness Eases
  FxWirePro: GBP/NZD maintains bersish bias with focus on 2.2900 level
  FxWirePro: GBP/AUD gains some upside momentum but still bearish
  FxWirePro: NZD/USD edges lower, remains on back foot


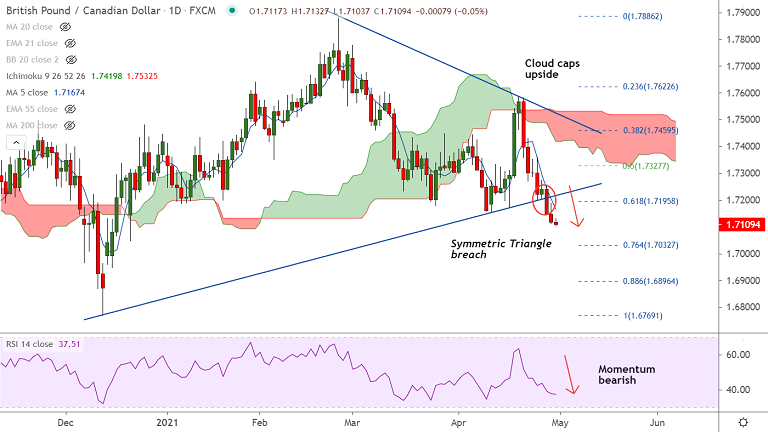
GBP/CAD chart - Trading View
GBP/CAD was trading rangebound on the day at 1.7114 at around 06:35 GMT, with session high at 1.7132 and low at 1.7103.
The pair has paused downside at major support at 200W MA at 1.7091, break below required for further weakness.
Technical indicators are biased lower. Momentum studies are strongly bearish. MACD and ADX support downside in the pair.
Price action has confirmed breach of Symmetric Triangle pattern which reinforces downside in the pair.
Analysis of GMMA indicator shows major and minor trend are bearish. Volatility is high and bearish momentum is likely to drag prices lower.
The pair has slipped below 61.8% Fib and is on track to test 76.4% Fib at 1.7032. Failure to break below 200W MA will negate any bearish bias.


