


 JPY Action Bias: USDJPY Emerges as the Clear Bullish Pair to Watch Amid Mixed Crosses
  Crypto Action Bias: ETHUSD Stands Out as the Bullish Pair to Watch
  EUR/JPY Holds Bullish Bias as Euro Extends Recovery
  FxWirePro: EUR/AUD outlook weaker on renewed downside pressure
  FxWirePro: USD/JPY eases ahead of Fed decision , Intervention risks linger
  FxWirePro: GBP/USD edges higher as traders await BoE guidance and UK fiscal clarity
  Major Forex Pairs Action Bias: GBPUSD and AUDUSD Turn Extremely Bearish
  FxWirePro- Woodies pivot (Major)
  FxWirePro: AUD/USD dips after RBA Governor speech
  FxWirePro- Major Pair levels and bias summary
  NZDJPY Pullback: Sell Rallies Toward 93.30 as Yen Weakness Eases
  FxWirePro: NZD/USD edges lower, remains on back foot
  FxWirePro: EUR/NZD up trend gains momentum but hurdles ahead
  AUDJPY Weakness Deepens: Sell Rallies Toward 112 as Aussie Dollar Falters
  FxWirePro: GBP/NZD maintains bersish bias with focus on 2.2900 level
  FxWirePro: NZD/USD neutral in the near-term, scope for downward resumption


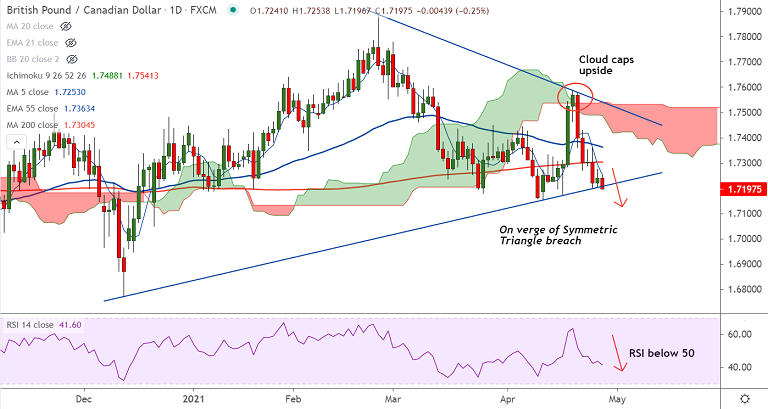
GBP/CAD chart - Trading View
Technical Analysis: Bias bearish
- GBP/CAD was trading 0.27% lower on the day at 1.7194 at around 11:00 GMT
- Price action is set to extend break below 200-DMA, outlook bearish
- Gravestone Doji formation on the previous week's candle dents upside
- Oscillators are bearishly aligned, Stochs and RSI are biased lower and RSI is below the 50 mark
- MACD shows bearish crossover on signal line, 5-DMA has confirmed a bearish crossover on 20-DMA
- -ve DMI dominance adds to the bearish bias, ADX is rising in support of the downside
- GMMA indicator shows major and minor trend are bearish
Support levels - 1.7110 (Lower BB), 1.7091 (200W MA), 1.70 (psychological mark)
Resistance levels - 1.7252 (5-DMA), 1.7304 (200-DMA), 1.7353 (200H MA)
Summary: GBP/CAD is attempting breach at Symmetric Triangle base at 1.7205. Decisive break below will drag prices lower. Scope for test of 200W MA at 1.7091 ahead of 1.70.


