


 FxWirePro: EUR/AUD outlook weaker on renewed downside pressure
  NZDJPY Pullback: Sell Rallies Toward 93.30 as Yen Weakness Eases
  FxWirePro- Major Pair levels and bias summary
  JPY Action Bias: USDJPY Emerges as the Clear Bullish Pair to Watch Amid Mixed Crosses
  FxWirePro : USD/JPY holds relatively bid on 163 ahead Of FOMC,BoJ meetings
  FxWirePro- Woodies pivot (Major)
  AUDJPY Weakness Deepens: Sell Rallies Toward 112 as Aussie Dollar Falters
  FxWirePro: USD/CAD gaining momentum for a move towards 1.4200 level
  FxWirePro: EUR/NZD up trend gains momentum but hurdles ahead
  Major Pairs Action Bias: USDCAD and USDCHF Stand Out as Extremely Bullish While GBPUSD and NZDUSD Turn Extremely Bearish
  EUR/USD Bounces from Monthly Low, But Bearish Pressure Remains
  EUR/JPY Holds Bullish Bias as Euro Extends Recovery
  FxWirePro: GBP/NZD maintains bersish bias with focus on 2.2900 level
  FxWirePro: USD/CAD runs out of steam but maintains bullish outlook
  FxWirePro: GBP/AUD downside pressure builds, key support level in focus
  Crypto Action Bias: ETHUSD Stands Out as the Bullish Pair to Watch


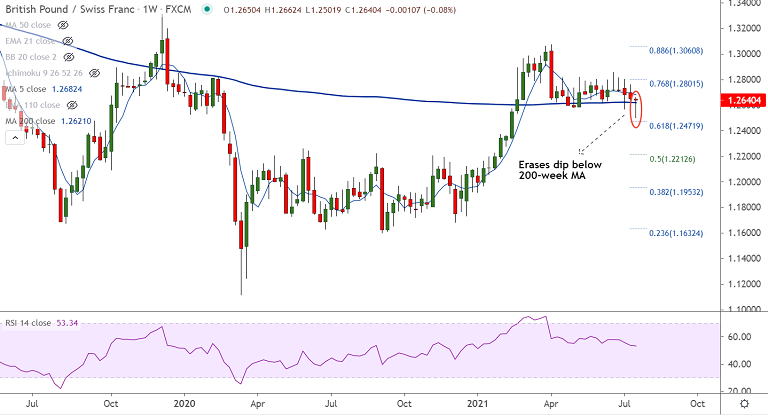
GBP/CHF chart - Trading View
Technical Analysis: Bias turning Bullish
- GBP/CHF was trading 0.55% higher on the day at 1.2640 at around 11:00 GMT
- The pair is extending gains for the 2nd straight session after Doji formation on Tuesday's candle
- Price action has edged above 110-EMA and is testing intraday resistance at 200H MA
- Stochs and RSI are showing a turn higher, GMMA shows minor trend has turned bullish on the intraday charts
- The pair has retraced dip below 200-week MA and has formed a 'Hammer' on the weekly charts till date
Support levels - 1.2621 (200-week MA), 1.2585 (5-DMA), 1.2538 (Lower BB)
Resistance levels - 1.2641 (200H MA), 1.2660 (21-EMA), 1.2684 (55-EMA)
Summary: Major trend for the pair is bearish. Failure to close below 200-week MA dents further downside. That said, recovery needs more evidence to confirm upside resumption. Cloud breakout will confirm bullish bias for the pair.


