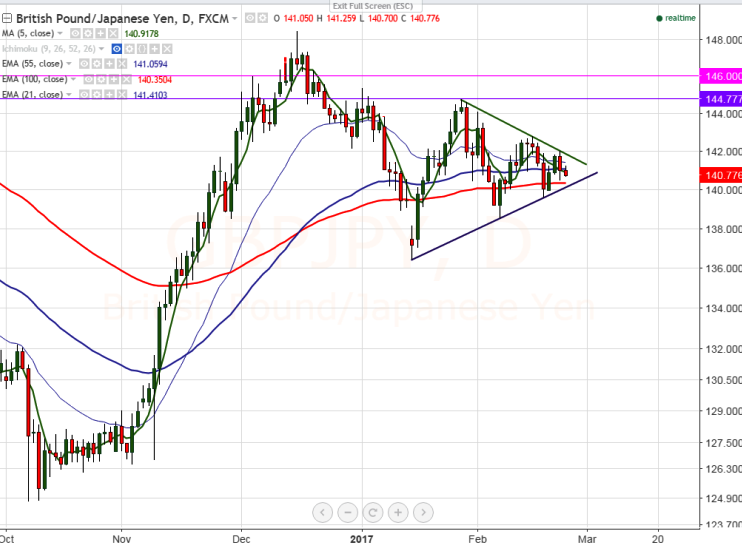
FxWirePro: GBP/JPY forms symmetrical triangle pattern, good to sell on rallies
Chart pattern- Symmetrical triangle pattern Major resistance – 142.05 (trend line joining 144.78 and 142.80) Major support – 139.40 (200- day MA) GBP/JPY has declined once again after jumping till 142.05 yesterday. Short…
Major resistance – 142.05 (trend line joining 144.78 and 142.80)
Major support – 139.40 (200- day MA)
GBP/JPY has declined once again after jumping till 142.05 yesterday. Short term bullishness can be seen only above 142.05.
The pair is facing strong trend line resistance at 142.05 and any close above targets 144.13 high made on Feb 1st 2017/144.78 (Jan 27th 2017 high).
On the lower side, any break below 141 (55- day EMA) will drag the pair till 140/139.35 (200- day MA)/ 138.50 (Feb 7th 2017 low)/136.45 (Jan 16th 2017 low).
It is good to sell on rallies around 141-14.10 with SL around 142.05 for the TP of 140/139.40.