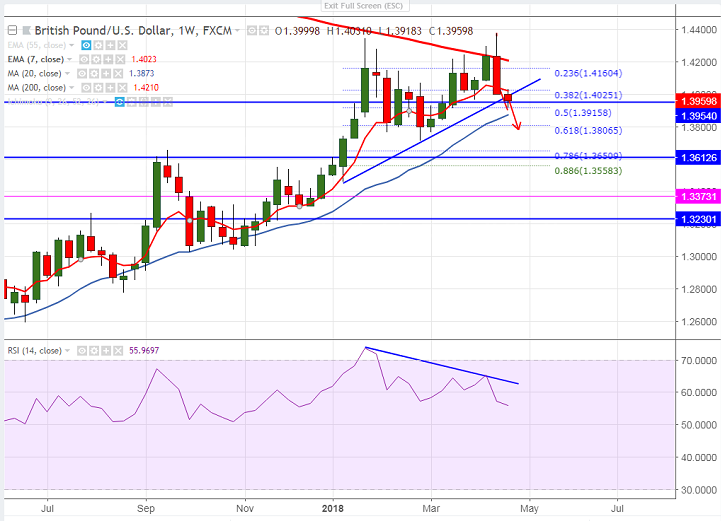
FxWirePro: GBP/USD forms Bearish Engulfing pattern in weekly chart, good to sell on rallies
Candle stick pattern –Bearish Engulfing pattern (Weekly chart). Cable has shown huge decline almost more than 350 pips in previous week and is continuing its bearish in this week. The pair has formed bearish engulfing pa…
Cable has shown huge decline almost more than 350 pips in previous week and is continuing its bearish in this week. The pair has formed bearish engulfing pattern in the weekly chart and momentum indicator also showing bearish divergence.
Fundamentally economic data such as UK employment, CPI and retail sales came slightly weaker than expected. The dovish comment by BOE Carney confirms slight delay in the rate hike by BOE.
The pair’s near term major support is around 1.3915 (50% fibo) and any break below will drag the pair down till 1.3860/1.3800. Short term bullish invalidation only below 1.3700.
On the higher side, near term resistance is around 1.4010 (10- W MA) and any break above will take the pair till 1.4050 (7- W EMA)/1.4100.
It is good to sell on rallies around 1.3990-95 with SL around 1.4050 for the TP of 1.3915/1.3865.