


 EUR/USD Slides After ECB Hold, Bearish Technicals Favor Rally Fades
  Crypto Bias Report: Trend Signals and Top Bullish Picks
  NZDJPY Bullish Dip-Buy Setup: 93.60 Support Unlocks Path to 97
  FxWirePro- Woodies pivot (Major)
  AUDJPY Extends Four-Day Rally as Yen Weakness Fuels Fresh Buying Opportunity
  JPY Action Bias: USDJPY, EURJPY, and CADJPY Emerge as Top Extremely Bullish Picks
  FxWirePro: AUD/USD uptrend loses steam, remains on bearish path
  FxWirePro: EUR/NZD firms after ECB holds rates steady at 2.25%
  FxWirePro- Major Crypto levels and bias summary
  FxWirePro:USD/JPY hovers near a four-decade low
  FxWirePro: GBP/NZD gains some ground but outlook is bearish
  FxWirePro- Woodies pivot (Major)
  BTC, ETH, SOL, XRP, and BNB: Major Crypto Pairs Stay Neutral
  Major Pairs Action Bias: USDCHF Emerges Extremely Bullish as EURUSD and GBPUSD Turn Deeply Bearish
  FxWirePro: USD/CAD edges lower but bullish outlook persists
  Major Pairs Bias: USDCHF Bullish While GBPUSD Turns Bearish
  FxWirePro- Major Crypto levels and bias summary


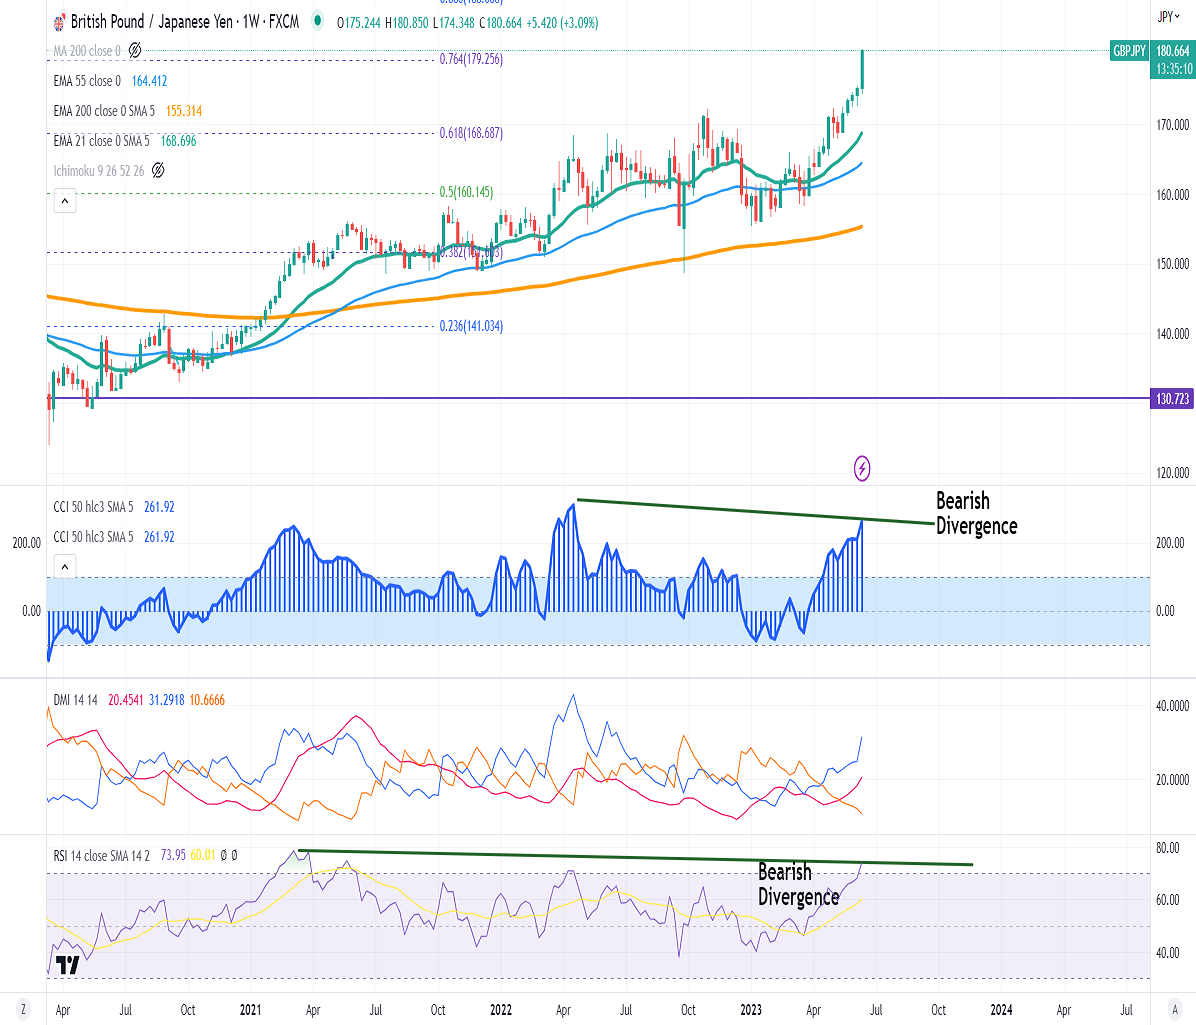
FxWirePro- GBPJPY -Bearish Divergence in the weekly chart
Chart pattern- Bearish divergence (CCI (50) and RSI(14)
GBPJP was one of the best performers this week and jumped more than 500 pips on the strong pound sterling. It hits an intraday high of 180.63 and is currently trading around 180.55.
GBPUSD- Trend- Bullish
The pound sterling climbed sharply and hits its highest level in 14 months on board-based US dollar selling. Bank of England expected to hike further in coming months. The policy divergence between US Fed and BOE supports the pound sterling at lower levels. Any weekly close above 1.2800 confirms further bullishness.
USDJPY- Bullish
The pair pared some of its gains after BOJ's dovish status quo. Significant Resistance is 143/145.
GBPJPY analysis-
The near-term support is around 179.69, a breach below targets 179.30/178.25/177. The immediate resistance is at 181, any violation above will take the pair to 182/183.
Indicators (4-hour chart)
CCI (50)- Bullish
ADX- Bullish
It is good to sell on rallies around 181.10-15 with SL around 182.40 for a TP of 178/177.


