


 FxWirePro: USD/JPY dips as market assess risk of additional FX intervention.
  FxWirePro: GBP/AUD drifts lower after BOE rate decision
  FxWirePro- Major Crypto levels and bias summary
  FxWirePro: GBP/NZD remains weak, eyes 38.2%fib support
  FxWirePro: USD/CNY dips to hit three year low,scope for further downside
  JPY Currency Meter Signals: NZDJPY Bullish (+25) vs CHFJPY (-100) – These Pairs Could Move Next
  FxWirePro: NZD/USD consolidates overnight gains, but loses momentum
  FxWirePro- Major Crypto levels and bias summary
  Nikkei Surges Past 65,000 on Suspected Yen Weakness: Tech Giants Like Advantest and NEC Lead Explosive Gains
  FxWirePro: GBP/NZD remains weak, eyes 38.2%fib support
  Major FX Action Bias & US Market Sentiment: NZD/USD (Extremely Bullish) & AUD/USD (Bullish) Watchlist
  US Magnificent 7 Stocks Trend Score: Amazon & Microsoft Hit Extreme Bullish (+100) as Meta Drops to -100 — Key Resistance & Support Watchlist
  Major European Indices Score Extremely Bullish: DAX Eyes 26000, CAC Targets 8600, FTSE100 at 11000 – Key Levels to Watch
  FxWirePro- Major Pair levels and bias summary
  FxWirePro: AUD/USD gains some ground but outlook is bearish
  AUDJPY Volatile After Massive Sell-Off: Sell Rallies at 113, Targeting 110 as Bearish Momentum Surges


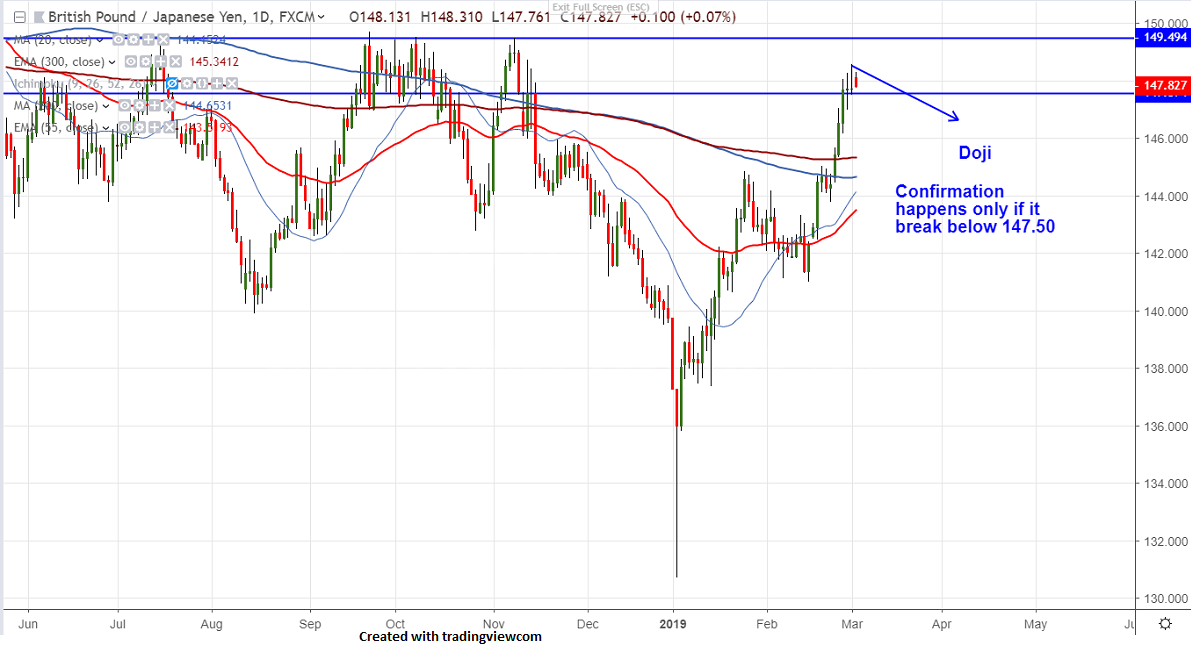
Candlestick pattern- Doji
The pair is trading higher for past 11 days and jumped more than 850 pips. The pair hits high of 148.57 and is currently trading around 147.83.
GBPJPY has formed doji in daily chart and bearish confirmation happens only if it trades below 147.50 and any break below will drag the pair till 146.83 (23.6% fib)/146.16/145.30 (300- day EMA).
On the higher side, major resistance is around 148.60 and any violation above will take the pair to next level till 149.30/149.71.
It is good to sell below 147.50 with SL around 148.25 for the TP of 145.35.


