


 FxWirePro- Major Crypto levels and bias summary
  FxWirePro: EUR/ AUD dips below 1.6300 level, focus on near term support
  FxWirePro: USD/CAD retreats slightly but trend is still bullish
  FxWirePro: GBP/AUD dips amid heightened Geopolitical concerns
  FxWirePro- Major Pair levels and bias summary
  ETHUSD Breaks Above $1900 as Bulls Eye $2300 and Beyond
  FxWirePro: EUR/ AUD downtrend loses steam, remains on bearish path
  FxWirePro: USD/CNY gains some upside momentum but bias still bearish
  FxWirePro- Major Pair levels and bias summary
  FxWirePro: USD/CAD retains bid tone,eyes 1.4200 level
  Major Pair Action Bias: USDCHF Turns Bullish as EURUSD Stays Bearish – Key Pairs to Watch
  FxWirePro: GBP/USD stays below 1.3400 level following cooler inflation report
  FxWirePro: USD/ZAR slips as rand gains on U.S.-Iran developments
  FxWirePro: GBP/USD slips as Middle East tensions boost safe-haven dollar


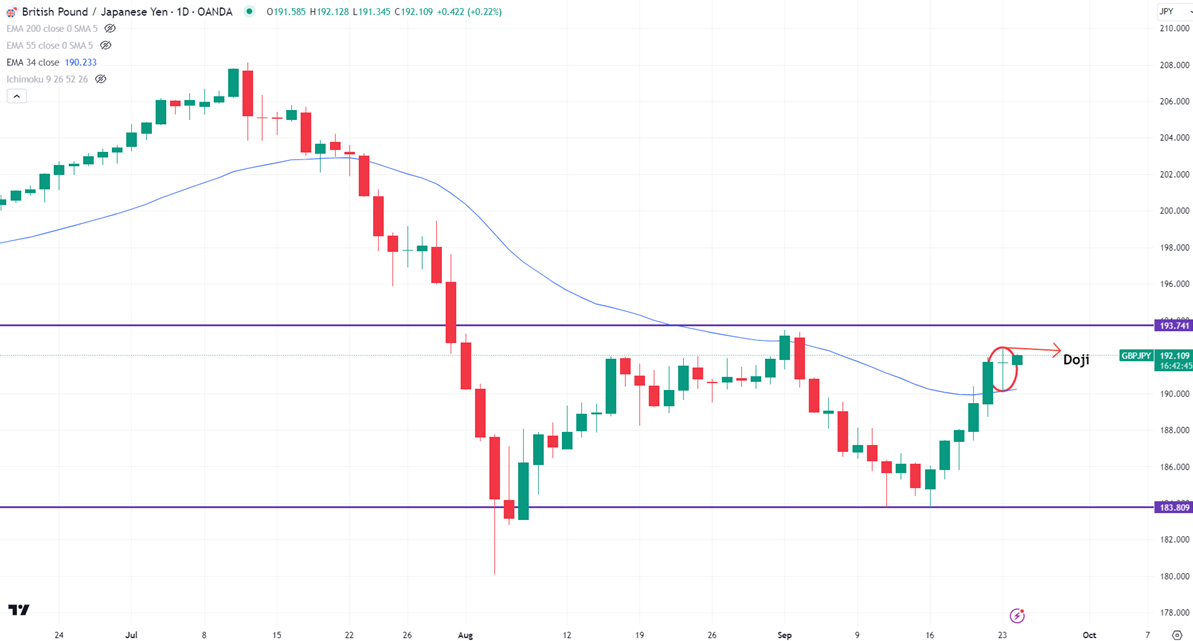
Candlestick pattern- Long-legged Doji
GBPJPY hits a multi-week high on strong Pound sterling. It hit a high of 192.44 yesterday and is currently trading around 192.15 Intraday trend is bullish as long as support 190 holds.
UK manufacturing and services PMI came well below expectations increasing the chance of a rate cut by BOE's next meeting.
Technicals-
The pair trades above short-term 34, below 55 EMA (190.02 and 191.71), and long-term 200 EMA (191.51) in the daily chart.
The near-term resistance is around 192.50, a breach above target 193.50. Major trend continuation only above 193.50. Any violation above will take the pair to 195. The immediate support is at 191.70, any violation below will drag the pair to 191.35/190.95/190/189.10/188.
Indicator (4-hour chart)
CCI (14)- Bullish
CCI (50)- Bullish
Average directional movement Index - Neutral. All indicators confirm the mixed trend.
It is good to sell on rallies around 192.40-42 with SL 193.50 for a TP of 190.


