FxWirePro: Gold 100 day EMA and Bearish Divergence
Monday, January 23, 2017 5:58 AM UTC
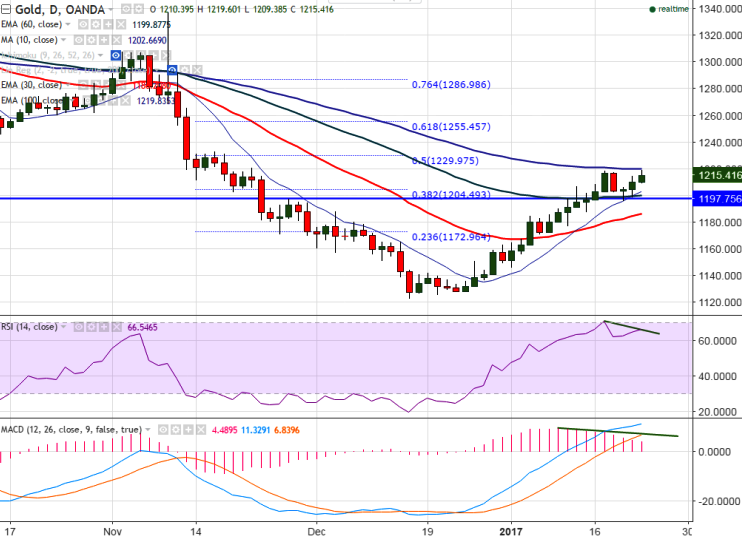
- Pattern formed- Bearish Divergence (RSI and MACD)
- Major support - $1199 (10- day MA).
- Major resistance - $1220 (100- day EMA).
- The yellow metal has jumped till $1219.60 on Friday on account of weak U.S dollar. Gold has taken support near 10- day MA and jumped sharply from that level. It is currently trading around $1215.40.
- In the daily chart gold has formed bearish divergence in RSI and MACD, a decline till $1199 is possible.
- Gold major resistance is around $1220 (100- day EMA) and any break above targets $1234/$1247 (50% retracement of $1375 and $1122) in the short term.
- On the lower side, immediate support is around $1199 (10- day MA) and any indicative break below targets $1184 (30- day EMA)/$1170 (daily Kijun-Sen)/$1159 (61.8% retracement of $1122 and $1218.94).
It is good to sell on rallies around $1217-$1219 with SL around $1230 for the TP of $1199.


 Bitcoin's Tug-of-War: Bulls Eye 80,000 USD Despite Turbulent ETF Outflows
  FxWirePro: GBP/AUD downtrend extends, eyes 1.8900 evel
  FxWirePro: AUD/USD slips amid wavering risk sentiment
  FxWirePro: NZD/USD neutral in the near-term, scope for downward resumption
  FxWirePro- Major European Indices
  FxWirePro- Major European Indices
  FxWirePro- Woodies Pivot(Major)
  FxWirePro: EUR/AUD falls below 1.6600 level, plunge to test a key fibo grows
  FxWirePro- Major Crypto levels and bias summary
  Ethereum Braces for Volatility: Technicals Turn Bearish as Geopolitical Tensions Loom
  GBPJPY Surges to 211.88: Sterling Bulls Target 215 Amid Broad-Based Buying
  FxWirePro- Woodies Pivot(Major)
  FxWirePro: EUR/ NZD consolidating around 2.0200, room for further gains
  FxWirePro: USD/CNY drifts lower, vulnerable to more downside
  NZDJPY Bearish Breakdown: Why Selling the Rallies is the Strategic Play