


 FxWirePro: GBP/AUD dips amid heightened Geopolitical concerns
  FxWirePro: USD/CAD retains bid tone,eyes 1.4200 level
  GBPJPY Weakens on Soft UK CPI: Sell Below 217.80 Targeting 216.40
  FxWirePro: GBP/NZD gains some upside momentum but still bearish
  FxWirePro: AUD/USD bulls struggles as upside momentum fades
  AUDJPY Pulls Back on Profit Booking: Buy Dips Toward 117/118
  Major Pair Action Bias: USDCHF Turns Bullish as EURUSD Stays Bearish – Key Pairs to Watch
  FxWirePro- USD/CHF Holds Above 0.8120 as Bulls Target 0.8200
  FxWirePro: EUR/ AUD dips below 1.6300 level, focus on near term support
  FxWirePro- Major Pair levels and bias summary
  FxWirePro- Woodies pivot (Major)
  FxWirePro: GBP/USD slips as Middle East tensions boost safe-haven dollar
  FxWirePro- Woodies pivot (Major)
  JPY Action Bias: USDJPY, AUDJPY & EURJPY Turn Extremely Bullish – Top Pairs to Watch
  FxWirePro: USD/ZAR slips as rand gains on U.S.-Iran developments


 - EconoTimes)


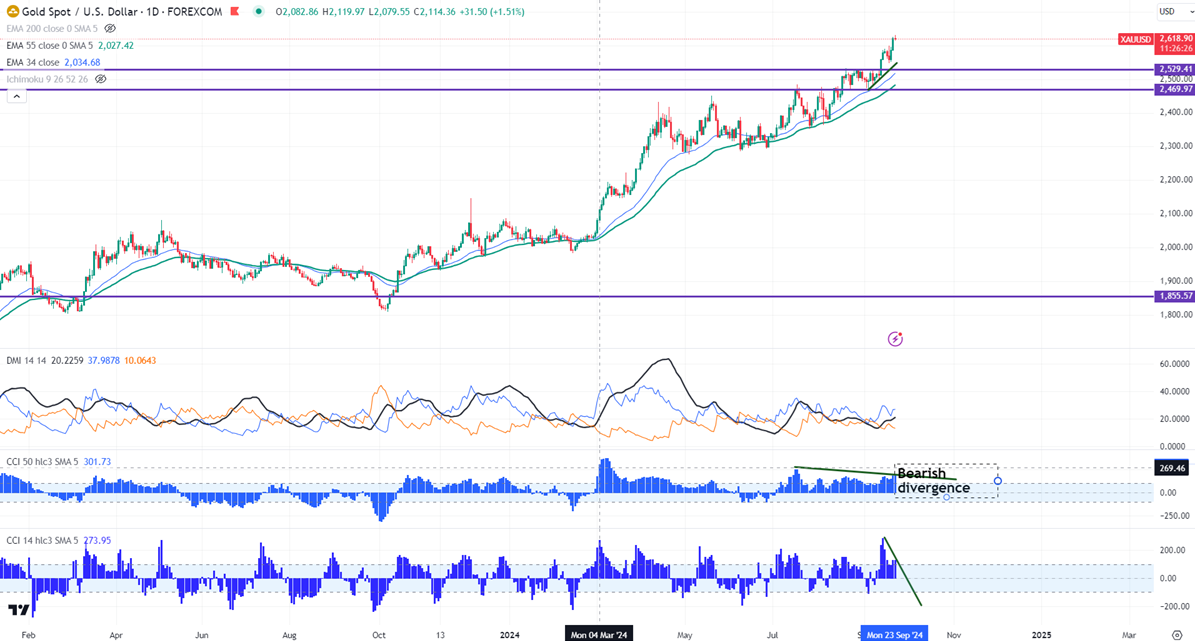
Chart pattern- Bearish Divergence (CCI (500 and CCI (14)
Gold pared some of its gains after hitting a fresh all-time high. It hits a high of $2631 and is currently trading around $2617.88.
The yellow metal was one of the best performers amid rate cuts and Middle East tensions.
Technical:
The near–term support is around $2604, a break below the target of $2570/$2560/$2545/$2520/$2470. Major bearish continuation only below $2470.The yellow metal faces minor resistance around $2630 and a breach above will take it to the next level of $2650/$2659.
Indicator (4- hour chart)
CCI (14)- Bullish
CCI (50)- Bullish
Average directional movement Index - Bullish
It is good to sell on rallies around $2620-21 with SL around $2635 for TP of $2570.


