


 JPY Action Bias: USDJPY Emerges as the Clear Bullish Pair to Watch Amid Mixed Crosses
  FxWirePro: USD/CAD positions for another climb, eyes 1.4150 level
  Major Pairs Action Bias: USDCAD and USDCHF Stand Out as Extremely Bullish While GBPUSD and NZDUSD Turn Extremely Bearish
  AUDJPY Action Bias: Bullish Dip-Buy Setup Despite Flat Neutral Bias
  NZDJPY Pullback: Sell Rallies Toward 93.30 as Yen Weakness Eases
  FxWirePro: EUR/AUD outlook weaker on renewed downside pressure
  FxWirePro: GBP/AUD under pressure as pound continues to weaken
  JPY Action Bias: Bullish Pairs to Watch Out For
  FxWirePro- Major Pair levels and bias summary
  FxWirePro: USD/CAD gaining momentum for a move towards 1.4200 level
  FxWirePro: GBP/NZD gains some ground but bias is still bearish
  NZDJPY Action Bias: Bullish Dip-Buying Opportunity on Broad Yen Weakness
  FxWirePro: USD/CNY dips as yuan firms on improving risk appetite
  FxWirePro : USD/JPY holds relatively bid on 163 ahead Of FOMC,BoJ meetings
  FxWirePro: GBP/AUD downside pressure builds, key support level in focus
  GBPJPY Slips After Sterling Weakness, Bears Eye 216


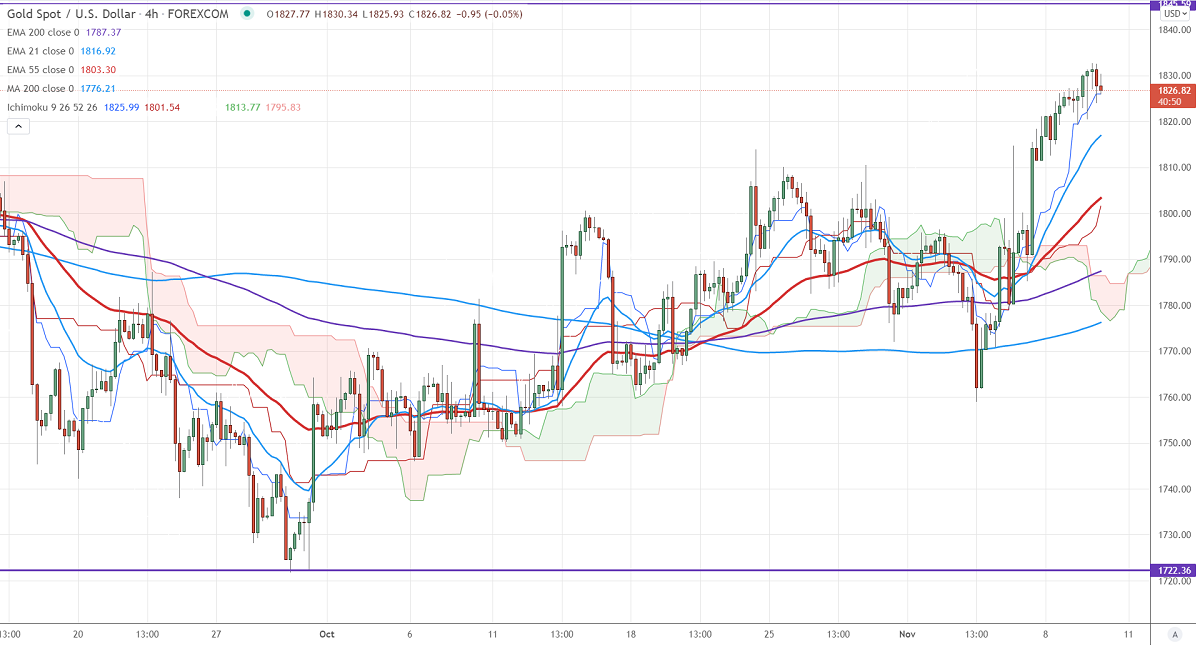
Ichimoku analysis (4-hour chart)
Tenken-Sen- $1825.98
Kijun-Sen- $1797.26
Gold surged slightly after US PPI data. It rose 0.6% in October in line with a forecast of 0.6%. The yearly PPI increased 8.6%, the highest annual pace in 11 years. The US dollar index is trading in a narrow range between 93.87 and 94.15 for the past day. Any close above 94.50 confirms further bullishness. The minor sell-off in US treasury yields also supported the yellow metal. Gold hits a high of $1832.75 and is currently trading around $1826.82.
Factors to watch for gold price action-
Global stock market- Slightly bullish (negative for gold)
US dollar index –Bearish (positive for gold)
US10-year bond yield- Bearish (positive for gold)
Technical:
It faces strong support at $1800 violation below targets $1780/$1760/$1750$1740. Significant trend continuation only below $1675. The yellow metal is facing resistance at $1835, any break above will take the yellow metal to $1860. The major bullish trend after it breaks $1835.
It is good to buy on dips around $1800 with SL around $1780 for TP of $1860.


