


 FxWirePro: AUD/USD gains on Iran-US truce hopes, risk rally
  FxWirePro : USD/JPY holds relatively bid on 163 ahead Of FOMC,BoJ meetings
  NZDJPY Pullback: Sell Rallies Toward 93.30 as Yen Weakness Eases
  FxWirePro: NZD/USD gains as U.S.-Iran peace hopes boost risk sentiment
  FxWirePro: USD/ZAR uptrend loses steam, remains on bullish path
  FxWirePro: AUD/USD dips after RBA Governor speech
  JPY Action Bias: USDJPY Emerges as the Clear Bullish Pair to Watch Amid Mixed Crosses
  FxWirePro: GBP/NZD gains some ground but bias is still bearish
  FxWirePro: EUR/NZD up trend gains momentum but hurdles ahead
  FxWirePro: GBP/USD downtrend loses steam but outlook still bearish
  FxWirePro: EUR/AUD outlook weaker on renewed downside pressure
  FxWirePro: NZD/USD edges lower, remains on back foot
  FxWirePro: USD/CAD positions for another climb, eyes 1.4150 level
  FxWirePro: USD/CNY dips as yuan firms on improving risk appetite
  FxWirePro- Major Crypto levels and bias summary
  FxWirePro- Major Pair levels and bias summary
  FxWirePro- Woodies pivot (Major)


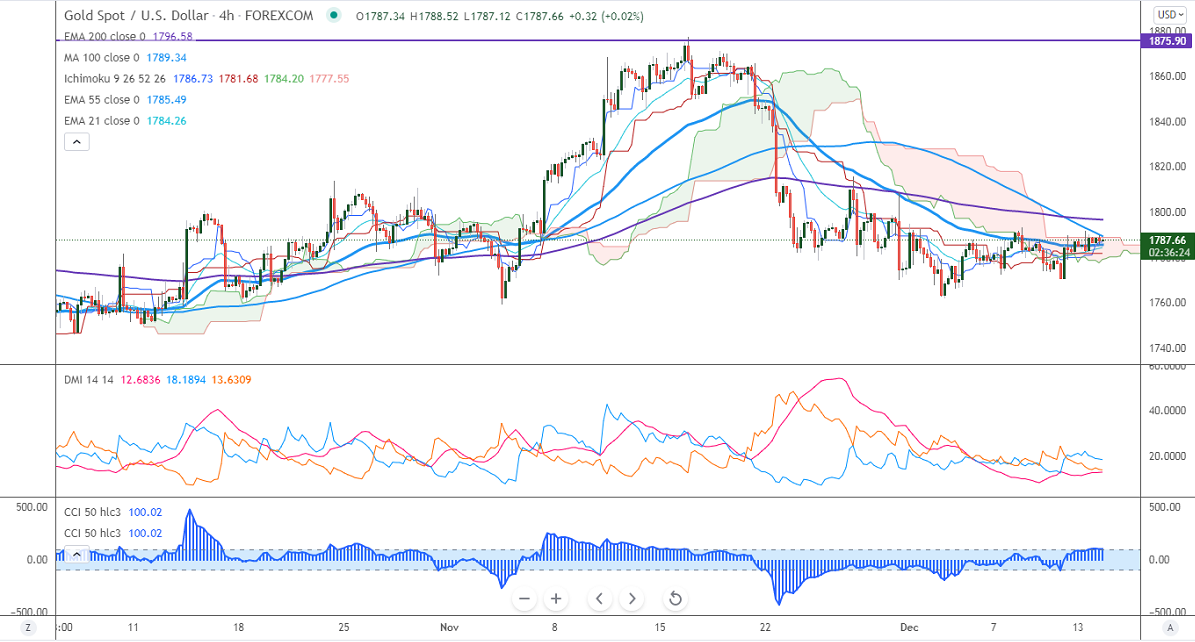
Ichimoku analysis (4-hour chart)
Tenken-Sen- $1786.50
Kijun-Sen- $1781.68
Gold is trading in a narrow range between $1770 and $1791.50. Markets eye Fed monetary policy meeting for further direction. US dollar index climbs more than 40 pips as first death due to Omicron supporting at lower levels. The bearish trend in US treasury yield is preventing the yellow metal from further downside.
Economic data-
US PPI – 1:30 pm
Factors to watch for gold price action-
Global stock market- Bullish (Negative for gold)
US dollar index –Bullish (negative for gold)
US10-year bond yield- neutral (mixed for gold)
Technical:
It faces strong support at $1770, violation below targets $1760/$1740/$1700.Significant trend continuation only below $1675. The yellow metal facing strong resistance $1792, any violation above will take to the next level $1800/$1815/$1835/$1860/$1900 is possible.
It is good to sell on rallies around $1800-01 with SL around $1815 for TP of $1762/$1740.


