


 FxWirePro: USD/CAD retreats slightly but trend is still bullish
  FxWirePro: USD/CNY attracts selling interest, vulnerable to more downside
  Major Pairs Bias: USDCHF Bullish While GBPUSD Turns Bearish
  FxWirePro: EUR/AUD neutral in the near term, scope for downward resumption
  FxWirePro: GBP/AUD downtrend loses steam but outlook still bearish
  FxWirePro- Woodies pivot (Major)
  Crypto Bias Report: Trend Signals and Top Bullish Picks
  FxWirePro: USD/ZAR surges as rand slumps after SARB rate hold surprise
  AUDJPY Extends Four-Day Rally as Yen Weakness Fuels Fresh Buying Opportunity
  FxWirePro: USD/CAD edges lower but bullish outlook persists
  FxWirePro: EUR/NZD firms after ECB holds rates steady at 2.25%
  FxWirePro: EUR/ AUD downtrend loses steam, remains on bearish path
  FxWirePro:USD/JPY holds above 163 as intervention fears keep traders on edge
  FxWirePro:NZD/USD edges higher as kiwi firms on hawkish RBNZ outlook
  FxWirePro: GBP/AUD bears maintain upper hand
  FxWirePro- Major Pair levels and bias summary


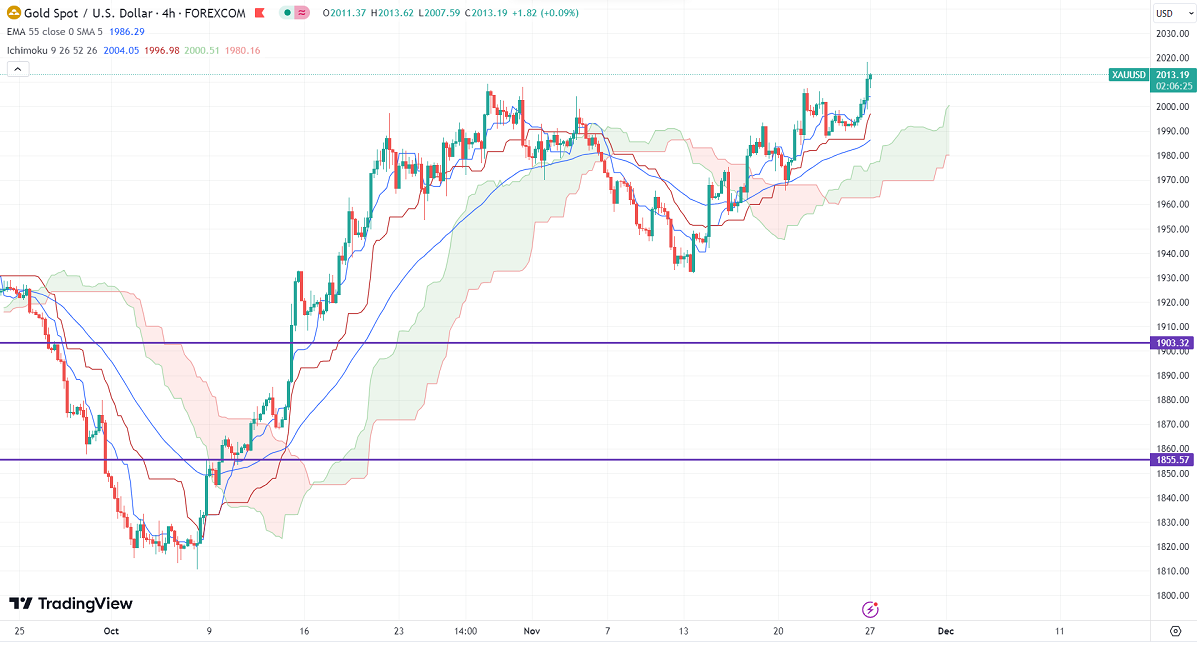
Ichimoku Analysis (4 hour chart)
Tenken-Sen- $2004.05
Kijun-Sen- $1993.56
Gold surged past $2000 on the weak US dollar. It hit a high of $2018 yesterday and is currently trading around $2010.51.
Major economic data for the week
Nov 27th, 2023, US New home sales (3:00 pm GMT)
Nov 28th 2023, S&P/CS Composite-20 HPI y/y (2:00pm GMT)
CB consumer confidence (3:00 pm GMT)
Richmond Manufacturing Index
US dollar index- Bearish. Minor support around 103/102. The near-term resistance is 104/105.
According to the CME Fed watch tool, the probability of a no-rate hike in Dec decreased to 97% from 100% a week ago.
The US 10-year yield showed a minor pullback after hitting a multi-week low. The US 10 and 2-year spread widened to -47% from -16%.
Factors to watch for gold price action-
Global stock market- Bullish (negative for gold)
US dollar index - Weak (positive for gold)
US10-year bond yield- Bearish (Positive for gold)
Technical:
The near–term support is around $1980, a break below targets of $1965/$1950/$1929/$1900/$1850. The yellow metal faces minor resistance around $2020 and a breach above will take it to the next level of $2030/$2050.
It is good to buy on dips around $1980-81 with SL around $1968 for TP of $2020.


