


 FxWirePro: GBP/USD stays below 1.3400 level following cooler inflation report
  Major Pair Action Bias: USDCHF Turns Bullish as EURUSD Stays Bearish – Key Pairs to Watch
  FxWirePro- USD/CHF Holds Above 0.8120 as Bulls Target 0.8200
  FxWirePro: USD/ZAR slips as rand gains on U.S.-Iran developments
  FxWirePro: GBP/NZD downtrend loses steam, remains on bearish path
  ETHUSD Breaks Above $1900 as Bulls Eye $2300 and Beyond
  FxWirePro- Major Pair levels and bias summary
  FxWirePro: GBP/USD slips as Middle East tensions boost safe-haven dollar
  FxWirePro- Major Crypto levels and bias summary
  GBPJPY Weakens on Soft UK CPI: Sell Below 217.80 Targeting 216.40
  FxWirePro: USD/CAD retains bid tone,eyes 1.4200 level
  FxWirePro: USD/CNY gains some upside momentum but bias still bearish
  AUDJPY Pulls Back on Profit Booking: Buy Dips Toward 117/118
  FxWirePro: EUR/ AUD downtrend loses steam, remains on bearish path


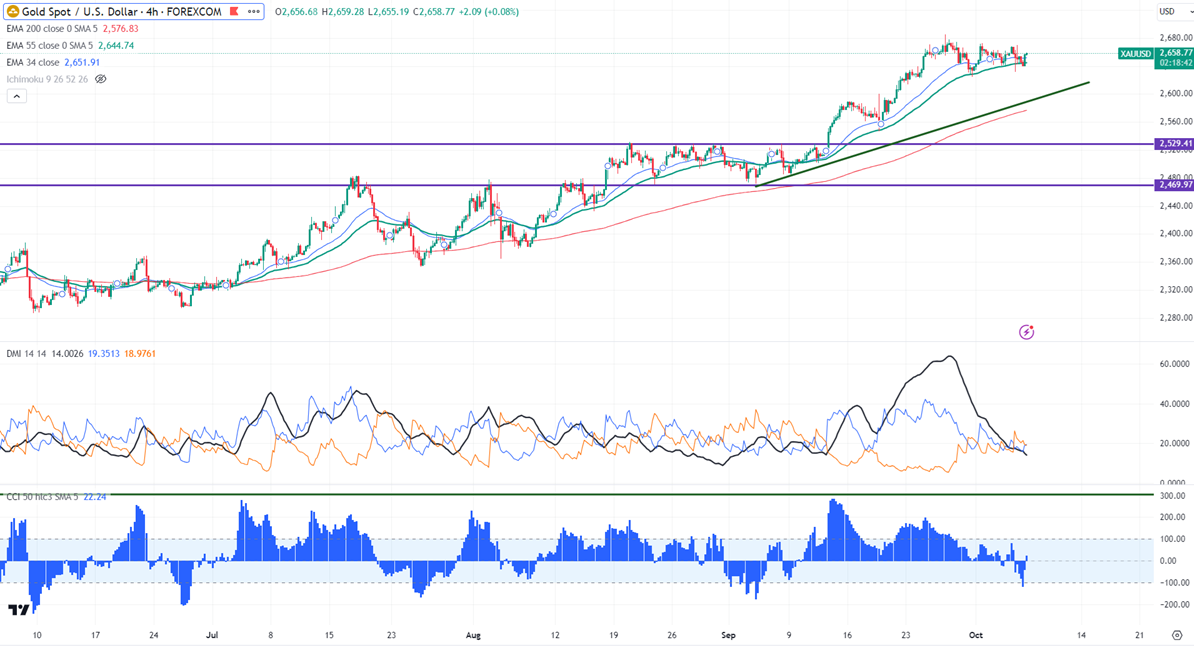
Gold is consolidating in a narrow range between $2670 and $2632 for the past two days. It hits a low of $2632 yesterday and is currently trading around $2658.
The upbeat US jobs data erased the chance of 50 bpbs by the Fed in the November meeting.
US dollar index-
The US dollar index holds above 102.50 a yield surges above 4%. Any close above 102.78 confirms a bullish continuation.
According to the CME Fed watch tool, the probability of a 25 bpbs rate cut in Nov increased to 96.90% from 46.70% a week ago.
Technical (4 hour chart)-
The yellow metal trades above short-term (34 and 55 EMA ) and long-term (200- EMA) in the 4- hour chart.
The near–term support is around $2640, a break below targets $2624/$2610/$2600/$2570/$2560/$2545/$2520/$2470. Major bearish continuation only below $2470.The yellow metal faces minor resistance around $2670 and a breach above will take it to the next level of $2689/$2700.
Indicator (4- hour chart)
CCI (50)- Neutral
Average directional movement Index - Neutral
It is good to sell on rallies around $2659-60 with SL around $2675 for a TP of $2600.


