


Gold technical model
- Gold Monthly chart – Looks still bullish and is trading above 10-M and 20- M MA ($1294 &$1270). It has formed almost triple top at $1365. Trend -Bullish
- Gold Weekly chart- It is showing a minor weakness and is trading slightly below 10- W MA ($1332).But any weekly close below $1319 (20- W MA) only confirms major weakness. Trend – Minor weakness
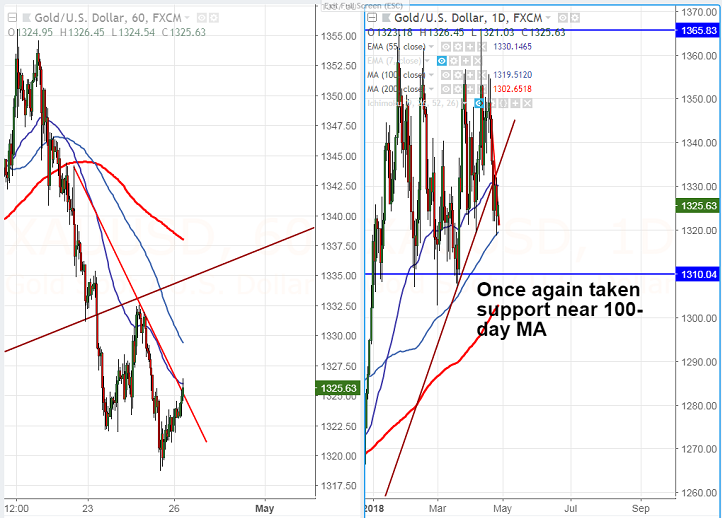
- Gold Daily Chart – The yellow trading below short term and medium term MA (20 day ($1336 and 50 day ($1332.50)). It has taken support near 100 –day MA at $1319. Trend – slightly weak. The yellow metal has taken support near 100 –day for past four times.
- DXY Daily chart- Trend bullish. The index after a long time has closed well above 100- day MA and a jump till 92 (200- day MA) is possible.
- US -10 year bond yield- Bullish. It hits 4 year yesterday and is trading around 3.01%. The near term resistance is around 3.04% and any break above confirms bullish continuation.
- This shows that short term trend is – bearish. Overall trend is still bullish as geo political tensions will increase demand of safe haven.
- The yellow metals near term resistance at $1332.50 (50- day MA) and any break above will take the yellow metal till $1338/$1344/$1348. The major bullishness only above $1365. Any break above $1365 will take the gold till $1374/$1380.
- On the lower side, near term support is around $1318 (100- day MA) and any break below will drag the yellow metal down till $1308/$1303 (200- day EMA).
It is good to sell on rallies around $1332-34 with SL around $1341 for the TP of $1319/$1309..


