
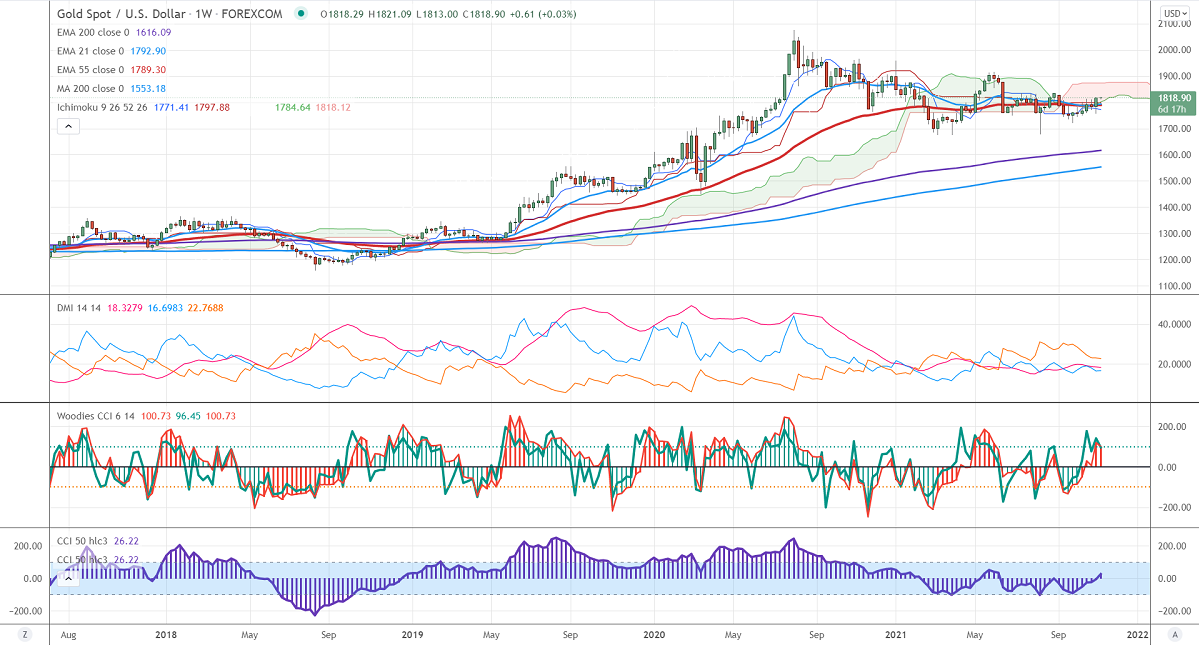
Ichimoku analysis (Weekly chart)
Tenken-Sen- $1776.03
Kijun-Sen- $1797.88
Gold surged sharply on the dovish Fed stance and weak labor participation. The US economy has added 531000 jobs in Sep compared to a forecast of 455000. While the unemployment rate dropped to 4.6% vs 4.7% last. The decline in the labor participation rate has dragged US treasury yields lower to a four-week low. The US dollar index showed a minor sell-off after gaining above 94.50. It should close above 94.50 level for further direction. Gold hits a high of $1821 and is currently trading around $1820.06.
Factors to watch for gold price action-
Global stock market- Slightly bullish (negative for gold)
US dollar index –Bullish (negative for gold)
US10-year bond yield- Bearish (positive for gold)
Technical:
It faces strong support at $1800 violation below targets $1780/$1760/$1750$1740. Significant trend continuation only below $1675. The yellow metal is holding above $1815, a jump till $1835 is possible. The major bullish trend after it breaks $1835.
It is good to buy on dips around $1800 with SL around $1780 for TP of $1860.


