


 NZDJPY Pullback: Sell Rallies Toward 93.30 as Yen Weakness Eases
  NZDJPY Action Bias: Bullish Dip-Buying Opportunity on Broad Yen Weakness
  Major Pair Action Bias: Bullish Pairs to Watch Out For
  FxWirePro- Major Crypto levels and bias summary
  FxWirePro- Woodies pivot (Major)
  FxWirePro: GBP/USD downtrend loses steam but outlook still bearish
  FxWirePro: GBP/NZD gains some ground but bias is still bearish
  FxWirePro : USD/JPY holds relatively bid on 163 ahead Of FOMC,BoJ meetings
  FxWirePro- Major Pair levels and bias summary
  FxWirePro: NZD/USD gains as U.S.-Iran peace hopes boost risk sentiment
  GBPJPY Slips After Sterling Weakness, Bears Eye 216
  FxWirePro: GBP/AUD downside pressure builds, key support level in focus
  FxWirePro: EUR/NZD up trend gains momentum but hurdles ahead
  FxWirePro: USD/ZAR uptrend loses steam, remains on bullish path
  FxWirePro: USD/CNY dips as yuan firms on improving risk appetite
  FxWirePro: GBP/AUD under pressure as pound continues to weaken


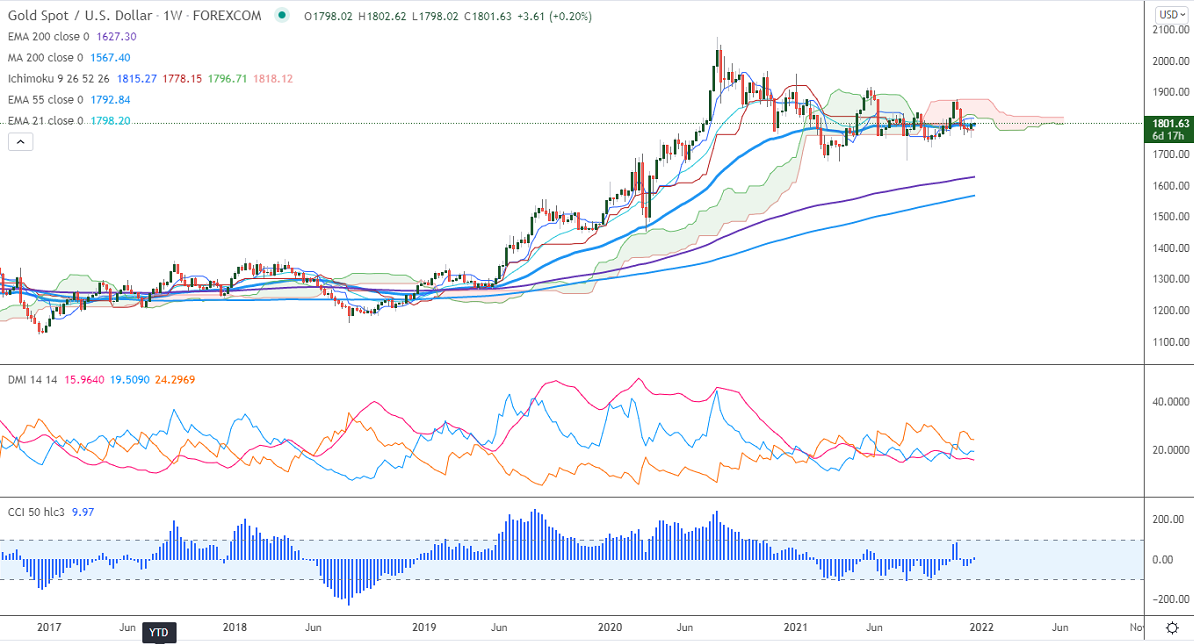
Ichimoku analysis (Weekly chart)
Tenken-Sen- $1815.27
Kijun-Sen- $1778.45
Gold lost more than $10 from a high of $1814 on the hawkish central bank. US central bank has kept its rate unchanged and doubled the size of tapering from $15 billion per month to $30 billion per month. Almost two-thirds of Fed members have projected two to three rate hikes in 2022. The Bank of England surprised markets by raising rates from a record low of 0.10% to 0.25% due to a jump in inflation. The US dollar index holding above 96.50, any breach above 97 confirms further bullishness. The yellow metal hits an intraday high of $1802.48 and is currently trading around $1801.87.
Factors to watch for gold price action-
Global stock market- Bearish (Positive for gold)
US dollar index –Bullish (negative for gold)
US10-year bond yield- Bearish (positive for gold)
Technical:
It faces strong support at $1780, violation below targets $1770/$1750/$1740/$1700.Significant trend continuation only below $1675. The yellow metal facing strong resistance $1815, any violation above will take to the next level $1835/$1860/$1900 is possible.
It is good to buy on dips around $1762-63 with SL around $1750 for TP of $1815/$1835.


