


 FxWirePro- Major Crypto levels and bias summary
  FxWirePro: NZD/USD under pressure amid US-Iran deterioration
  FxWirePro: GBP/NZD up trend gains momentum but hurdles ahead
  FxWirePro- Major Crypto levels and bias summary
  Gold Stalls Below $4150 as Hot CPI Fuels Dollar Strength and Safe-Haven Bid Fades
  FxWirePro: GBP/AUD maintains bullish bias with focus on 1.9100
  Sterling Surge: GBPJPY Powers Above 214.50 as Triple Bullish EMA Stack Signals Push to 217
  AUD/JPY Dead-Cat Bounce Halted by EMA Wall; Sell-on-Rise Eyes 110.50 Target
  FxWirePro: AUD/USD eases as middle east peace progress ebbs
  FxWirePro USD/JPY consolidates above 160.00 level despite fresh currency intervention threats
  USD/CHF Retreats to Key Trend-Line Wall; Buy-Above-0.8000 Strategy Targets Sharp Rally to 0.8150
  FxWirePro- Woodies pivot (Major)
  EUR/USD Relief Rally Crashes Into 200/365 EMA Wall: Sell-on-Rise Near 1.1600 Targets 1.1435
  NZD/JPY Bear Trap: Triple EMA Ceiling Blocks Relief Rally, Sellers Eye 90.50
  FxWirePro- Major European Indices


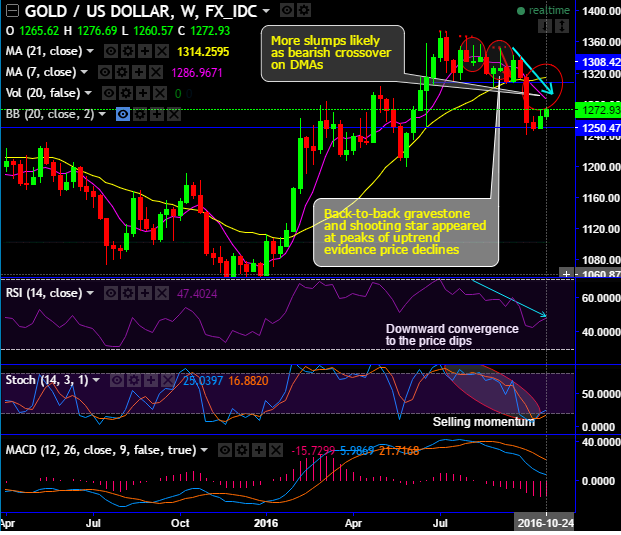
Before we begin with this technical write up, just to bring into your notice that this precious yellow metal has always been US rates sensitive commodity.
The gold price has been spiking at 3 weeks highs but remained well below DMAs.
We could also observe that the more slumps in gold prices likely as 7DMA crosses below 21DMA (which is a bearish crossover).
Prior to this price behavior, we had spotted out the back-to-back gravestone and shooting star patterns appeared at peaks of the uptrend that evidence price declines, rest is history by now as you could probably observe dips on weekly terms.
But for now, bulls attempt to reclaim gains in this week, it seems like bottoming out, is it really a bottoming out from 4-months’ lows? This has quite been a million dollar puzzle, we advise don’t jack up fresh longs on investment grounds as we don’t have confirmation on monthly terms, instead, bearish patterns and indications are popping (see for shooting star and bearish convergence by leading indicators on monthly terms).
So, ongoing upswings are not to be deemed as buying opportunities for long-term investors as we foresee more slumps to be evidenced as the current prices have gone below 7EMA on monthly plotting.
Major bearish observations:
On weekly charts, 7DMA crosses below 21DMA which is again a sell signal.
On monthly plotting, shooting star occurred at peaks (1315.55 levels) of the intermediary trend.
The current prices drifted below DMAs after the rejection of stiff resistance at 1385.
Both leading oscillators on weekly and monthly terms signal intensified selling momentum.
While MACD on the weekly terms evidences bearish crossover that is likely to drag prices down further.
Trading tips: How to use the ongoing rallies
Gold for December delivery on the Comex division of the NYME touched a session high of $1,277.20 a troy ounce, the most since October 5th.
Please be noted that the IV skews for 1w tenor are moving in sync with the delta risk reversals of the same tenor (i.e. neutral RR).
Well, the aggressive speculators can choose the credit put spreads as the selling indications are piling up on the weekly graph and with neutral hedging sentiments in next 1-weeks’ timeframe.
So, capitalizing on momentary rallies, shorting an in the money put option of 1-week expiry to reduce the cost of trading by financing this into the long position in an out of the money put option of the same expiry is recommended.


