FxWirePro: Gold edges higher to test $1360 resistance area
The yellow metal continues to shine brightly. The price of gold has declined steadily after failing to breach the key $1365-85 resistance area in 2018 but started recovering grounds fast since November last year. It has …
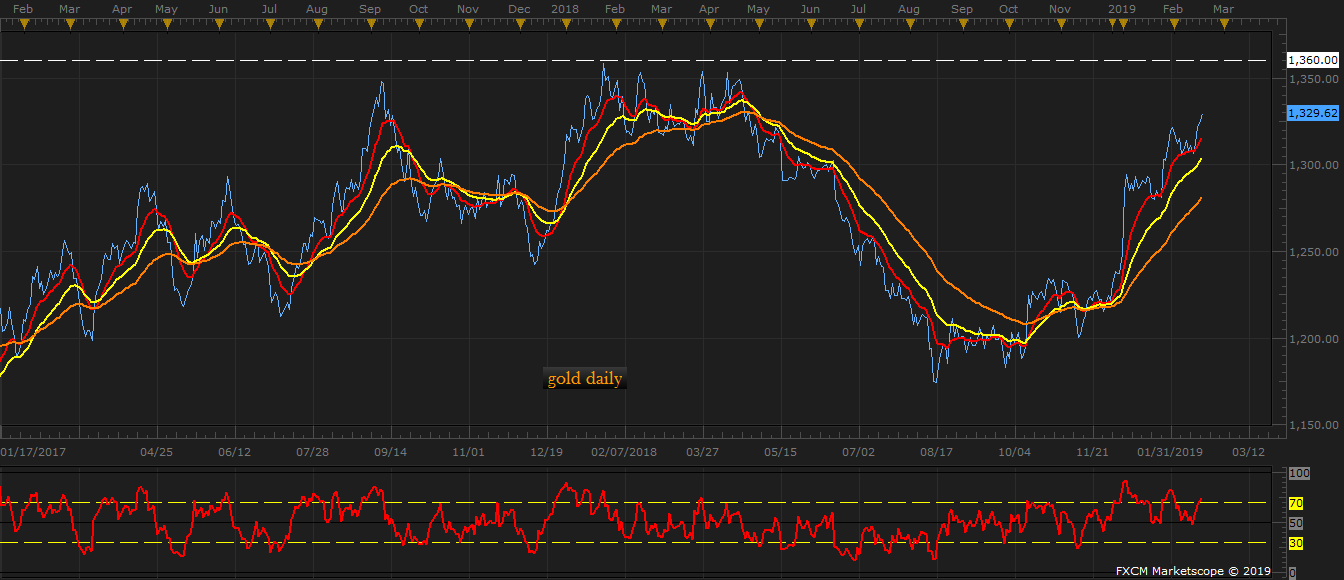
The price of gold has declined steadily after failing to breach the key $1365-85 resistance area in 2018 but started recovering grounds fast since November last year. It has jumped from $1200 area to in November to $1329 per troy ounce as of today.
While the $1365 area looks like pretty strong resistance, it is important to note that the yellow metal has broken the downtrend channel that has been in place since 2013, in early 2016. Since then the gold has been struggling to find its bullish touch. Since that break, the $1365 resistance area has been tested five times with no luck so far.
The chart shows that the price is coming close to the level once more and the yellow metal is faring much stronger.
Historically speaking, the price of USD has been one of the most crucial factors in gold’s bull and bear trend. A strong USD prevents gold from moving higher.
Currently, both gold and USD gaining hand in hand, which is very bullish for the yellow metal. However, sharp strengthening of USD would continue to hinder gold’s
Price is very likely to test $1365 resistance area.
Gold prices edged lower on Monday as stronger-than-expected U.S. nonfarm payrolls data dampened hopes for aggressive Federal Reserve rate cuts, bolstering the dollar. Spot gold slipped 0.1% to $2,686.32 an ounce, while F…
On-chain data shows BTC whales moved 10000 BTC from Crypto exchanges. This indicate accumulation of BTC by whales. Japanese public company Metaplanet buys another 1 billion yen worth of Bitcoin. According to Santiment, t…
Personal income increased by 0.2% month over month In August, which was less than the 0.4% market forecast and less than the 0.3% growth in July. For the third consecutive month, real personal disposable income increased…