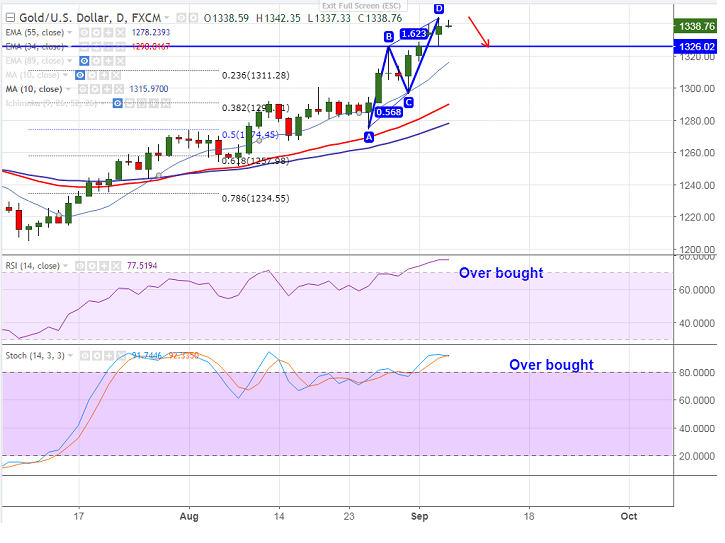
FxWirePro: Gold forms Bearish pattern in daily chart, good to sell on rallies
Harmonic Pattern formed – Bearish AB= CD Potential reversal Zone - $1344.20 Gold is trading continuously positive for the past eight trading session. The yellow metal hits fresh year high after breaking $1337 high made d…
Gold is trading continuously positive for the past eight trading session. The yellow metal hits fresh year high after breaking $1337 high made during Trump Presidential election result. It is currently trading around $1338.83.
Short term trend is still bullish as long as support $1296 low made on Aug 31st 2017 holds. The near term support is around $1320 (5- day MA) and any break below will drag the yellow metal till $1311 (10- day MA)/$1300.
On the higher side, any break above $1343 will take the gold till $1353/$1360.
RSI and Stochostic is showing overbought and so minor selling is possible.
It is good to sell on rallies around $1343-44 with SL around $1348 for the TP of $1330/$1324.