


- Gold prices declined sharply after making a temporary top at $1357.80 on Sep 2017. The yellow metal has made a low of $1277 and shown a minor jump from that level. Gold is trading weak on rising expectations of year end hike and Trump’s tax plan. It is currently trading around $12 0.19% lower.
- US GDP has slightly revised to 3.1% compared to forecast of 3.0%. Markets reacted very less after the data. The major data to be released are U.S personal income, personal spending and also as Chicago PMI.
- US Dollar index has shown a minor decline after forming a minor top at 93.67. The pair has taken support near 23.6% (93) and shown a minor jump. The near term resistance is at 93.35 (55- day EMA) and any break above will take the index to next level till 94.15.
- U.S 10 year yield has broken 233 –day MA for the first time since Aug 1st 2017 at 2.30% and rose till 2.34% .
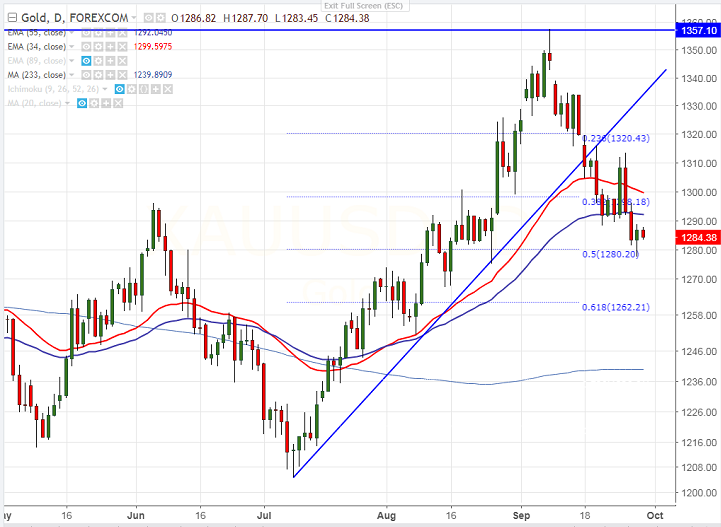
- Technically gold is facing minor resistance around $1292 (55- day EMA) and any break above will take the yellow metal till $1303 (10- day MA)/$1315.45 (daily Kijun-Sen).
- Gold’s near term support is around $1280 (50% retracement of $1204 and $1357.90) and break below will drag the commodity down till $1267 (.The yellow metal should break below $1250 for major trend reversal.
It is good to sell on rallies around $1282-84 with SL around $1292 for the TP of $1267/$1250.


