


 FxWirePro: GBP/AUD positions for another drop, eyes 1.8900level
  FxWirePro: GBP/NZD up trend gains some momentum but hurdles ahead
  FxWirePro:NZD/USD uptrend loses momentum but bullish setup remains
  FxWirePro: EUR/AUD downtrend loses steam but outlook still bearish
  FxWirePro- Major European Indices
  FxWirePro: USD/CAD extends decline on broad dollar weakness
  FxWirePro- Major Pair levels and bias summary
  FxWirePro: USD/CNY neutral in the near-term, scope for downward resumption
  Euro Holds the Line: EURUSD Finds Support at the 365-EMA as Peace Talks Loom
  Bitcoin’s Volatile Reset: ETFs Rebound as Bulls Eye USD 80,000 Milestone
  FxWirePro: AUD/USD retreats slightly but trend is still bullish
  FxWirePro: USD/CAD recovers slightly but bearish outlook persists
  FxWirePro- Woodies Pivot(Major)
  NZDJPY Bulls Charge Toward 95.00: Safe-Haven Exodus Drives Kiwi Rally
  FxWirePro: USD/ZAR edges lower ,investors remain on edge
  Energy Surge Ignites US Inflation: USDCHF Eyes Support Amid Dollar Sell-Off


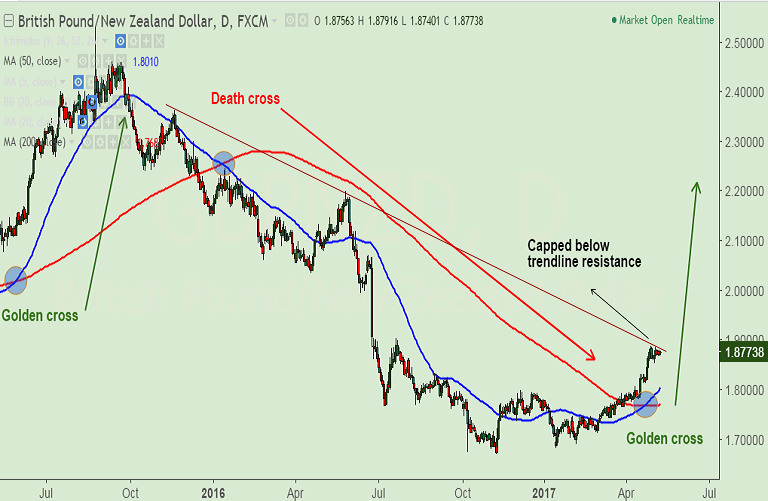
- GBP/NZD has picked momentum and is extending upside from record lows at 1.6705 hit during November 2016.
- We have evidenced a 'Golden Cross' formation (bullish 50-DMA crossover on 200-DMA) on the daily charts.
- The pair is currently struggling at major trendline resistance at 1.8845. Breakout will see resumption of upside.
- On the monthly charts, we see Stochs have rolled over from oversold levels and RSI has bounced off from near oversold zone.
- We see scope for test of 2.20 levels (May 2016 highs).
Support levels - 1.8467 (20-DMA) 1.8010 (50-DMA), 1.7687 (200-DMA),
Resistance levels - 1.8845 (falling trendline), 2.0 (June & Sept 2013 and Aug 2014 highs), 2.20 (May 2016 high)
Recommendation: Good to go long on breakout above trendline resistance at 1.8845, SL: 1.76, TP: 2.0/ 2.20
FxWirePro Currency Strength Index: FxWirePro's Hourly GBP Spot Index was at 91.4997 (Bullish), while Hourly NZD Spot Index was at 146.625 (Bullish) at 0620 GMT. For more details on FxWirePro's Currency Strength Index, visit http://www.fxwirepro.com/currencyindex.


