FxWirePro: Inverse saucer pattern forms on WTI crude, testing supports at 38.2% Fibonacci retracement; any breach below drags until 47.44
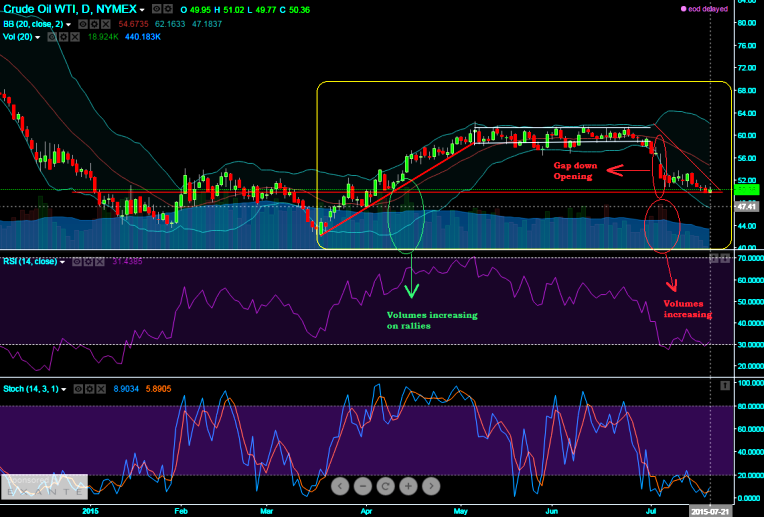
On EOD charts of WTI CL1! We traced out an inverse saucer pattern. Inverse saucer patterns can prolong for weeks or even extend into years. But for now the new trend that develops may last for a similar duration to the p…
On EOD charts of WTI CL1! We traced out an inverse saucer pattern. Inverse saucer patterns can prolong for weeks or even extend into years. But for now the new trend that develops may last for a similar duration to the previous trend it reversed at 60.27 levels.
This unusual formation evidences no clear price targets but usually implies quite a lot of potential since 50% or more retracement of the preceding uptrend can be expected. At the current levels this commodity price is testing a significant supports at 50.36 levels which is 38.2% retracement from peaks of previous uptrend.
Volume during inverse saucers formation with gap down opening at 54.90 resembles the bowl-like shape of prices during a saucer. Volume which was spiking high during such uptrend beginning (zone 42-60 as shown by red trendline) and then began cooling off as the expectations shift and again traders become indecisive during early May 2015 to end June 2015 (prices moved in a channel line as shown blue colored trendlines), Volume then increases as the new trend is established. We think any breach below the supports at 50.36 would certainly drag this commodity until 47.44 levels.
Australia's September 2026 labour report shocked to the negative: unemployment climbed to 4.7% from 4.6% and employment dropped by 39,300 against expectations for a 20,000 increase. Part-time work dropped by 73,700, whic…
UNCX Network, a cryptocurrency token vesting platform formerly known as UniCrypt, suffered a security exploit on Wednesday that drained approximately $86,000 from its shared Ethereum token pool. Blockchain security firm …
Solana is preparing to introduce its highly anticipated Alpenglow consensus upgrade on October 21, 2026, marking one of the blockchain's biggest technological changes since its launch in 2020. The upgrade aims to signifi…