


 Today’s space race could turn fatal if we don’t agree on new rules
  China’s AI Manufacturing Boom Masks Weak Consumer Economy, Citi Says
  Gold Surges Above Key EMAs, Bulls Eye Resistance Amidst Bullish Momentum
  How Donald Trump has changed the way diplomacy is done
  Gold's 365-Day EMA Streak Since Oct 2023 Faces Its First Real Test at $3,980 — Break or Bounce to $4,140?
  Silver Cracks Key 365-Day EMA for First Time Since Feb 2024; Bears Eye $50 on Rallies
  World Cup technology: from ref cams to AI analysts, cutting-edge research is changing the game
  Morgan Stanley Sees Chinese Auto Market Recovery Gaining Momentum in Late Summer


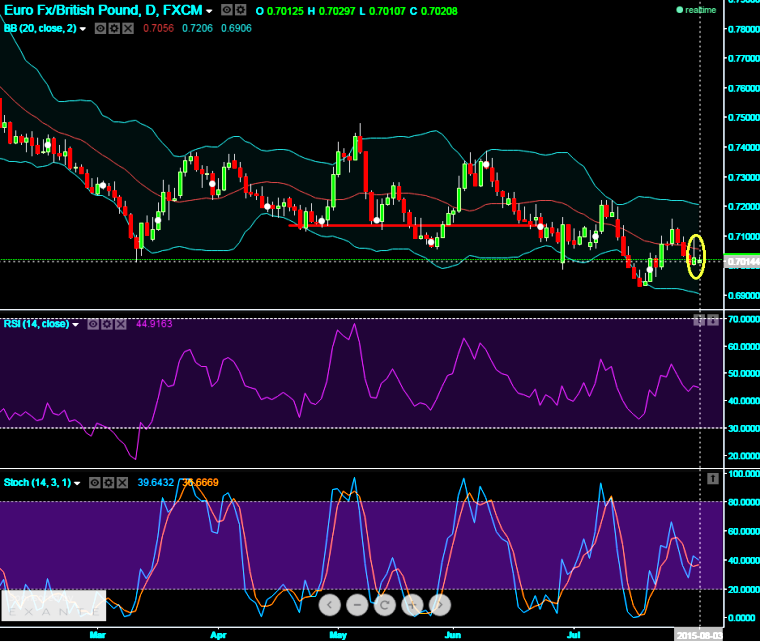
EOD technical charts have shown a slight recovery from last week's loses. An inverted hammer pattern is formed on Friday at 0.7027 levels and intraday sentiments are bullish bias but the healthy UK PMI is disturbing the rallies and leading indicators fortify these upswings with positive convergence.
Slight divergence on RSI is seen on daily charts as it is trending near 44.7875 levels with a supportive signal from stochastic curve as %K line crossover below 40 levels which is oversold territory. These signals can be attributed as positive movers for price recovery; however closing figures should be crucial for long-term decision making.
On a swing trading perspective, it is smart to buy at every dips, we advocate buying binary delta calls for targets of 20-25 pips. Intraday charts signals a sharp oversold situation as the %K line crossover occurred below 20 levels and RSI curve is also moving in convergence with spiking prices.

- News

- Economy

- Central Banks
- Investing
- Research
- Roundups
- Digital Currency
- Insights
- Technical Analysis
- Technology
- Business
- Law
- Health
- Nature
- Fintech
- Science
- Topic
- Opinions
- ©Econometrics LLC . All Rights Reserved.
FxWirePro: Inverted hammer formation signifies EUR/GBP’s recovery but UK PMI to disrupt; digital calls for 20 pips
Monday, August 3, 2015 9:07 AM UTC
Editor's Picks


- Market Data
Most Popular


