


 FxWirePro: GBP/USD hovers near three week low, bearish outlook remains
  FxWirePro: GBP/AUD eases slightly but trend is still bullish
  FxWirePro: USD/CAD bulls continue to hold the higher ground
  FxWirePro: GBP/NZD edges lower but bias is bullish
  FxWirePro: USD/ZAR erases early gains ,looking vulnerable
  AUD/JPY Dead-Cat Bounce Halted by EMA Wall; Sell-on-Rise Eyes 110.50 Target
  AUDJPY Cracks Below 113: Bearish Breakdown Accelerates Toward 110.50 Target
  EUR/USD Relief Rally Crashes Into 200/365 EMA Wall: Sell-on-Rise Near 1.1600 Targets 1.1435
  FxWirePro: EUR/ NZD bulls gain momentum,eyes level 2.0000
  FxWirePro: AUD/USD firms slightly, but downward resumption looks likely
  Sterling's Shine Fades: GBPJPY Sell-on-Rally Setup Targets 210.40 Breakdown
  FxWirePro- Major Crypto levels and bias summary
  FxWirePro: USD/JPY holds firm despite concerns over possible currency intervention
  FxWirePro:GBP/USD recovers some ground but bears are not done yet
  NZDJPY Bearish Reversal Intact: Triple EMA Stack Signals Sell-on-Rallies Play Toward 90.50
  FxWirePro- Woodies pivot (Major)


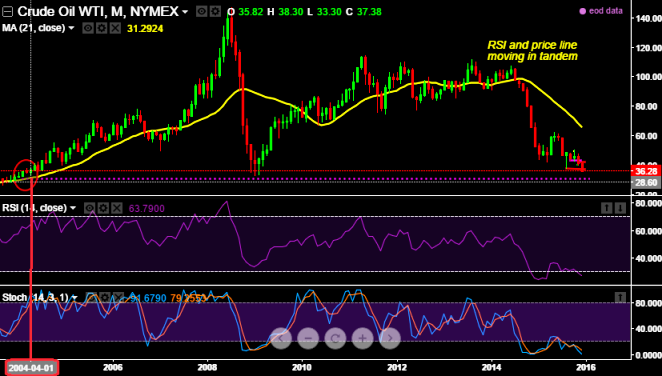
After having a look upon long term charts, a suspicion arrives in our brains.
Can the prevailing bear run surpass the least prices ever in recent history...? this question would take us to absolutely 11.5 years back (which was before April fool's day in 2004 at 33.20 or below).
Answer is here, we are not being stubborn, neither in love with number 35. We've observed the multiyear charts and coupled these outcomes with below significant fundamentals.
After reading we're pretty sure that you would certainly be able to answer correctly.
Briefing on what has been happened with bear run so far:
Commodities are experiencing what has already been the second-deepest and longest bear market of the past 45 years, with a decline from their peak of over 55% over the past 4.5 years.
Only the post-Lehman plunge was steeper (61% peak-to-trough), and only the 1981-86 one longer (5.5 years).
The bear market in commodity currencies has likewise been the second-worst of the post-Bretton Woods era, topped only by the early 1980s rout powered by the 1983-84 Fed tightening cycle.
From their 2011 peak, four commodities have depreciated at least 50% currencies (ARS, BRL, RUB, ZAR), and five others are down about 30% (NOK, AUD, COP, CLP, MYR).
Where is the stoppage supply glut: The global oil supply growth of only 0.3 million barrels per day in 2016 as US crude output falls from a mid-2015 peak of 9.6mbd to 8.8mbd due to record declines in capex (about -25% in 2015 and in 2016). OPEC supply growth should slow from about +1.2mbd in 2015 to +0.8mbd.
The Brent forecast shows a gradual rise over the next four quarters -$48 in Q1, $52 in Q2, $57 in Q3, $62 in Q4 -to reflect tighter balances from slower output growth rather than meaningful demand increases.
Thanks to almighty, among the entire commodity baskets crude oil is the only sector where sufficient supply adjustment is underway to lift prices in 2016.
Hence, our bearish stance likely to persist and $35 is pretty much certain, we want to play it safe and can only smell some bullish attributes after late December. But for now jumping the guns is absurd as the above fundamental developments are yet to factor in gradually in long run contemplating crystal clear confirmation.
We stand pat with our recent hedging stances given in below links, good luck:
http://www.econotimes.com/FxWirePro-WTI-crude-may-head-towards-deep-tunnel-Aggressive-bears-can-stay-hedged-with-ITM-delta-puts-128603
http://www.econotimes.com/FxWirePro-No-surprise-on-crudes-tumble-to-39-trajectories-OPEC-leads-to-price-war-ahead-%E2%80%93-stayed-hedged-with-32-spreads-127004

- News

- Economy

- Central Banks
- Investing
- Research
- Roundups
- Digital Currency
- Insights
- Technical Analysis
- Technology
- Business
- Law
- Health
- Nature
- Fintech
- Science
- Topic
- Opinions
- ©Econometrics LLC . All Rights Reserved.
FxWirePro: Is crude’s bear run worse than 2009 recessionary cycle? conviction at $35 or below deciding factor
Friday, December 11, 2015 3:12 PM UTC
Editor's Picks


- Market Data
Most Popular


