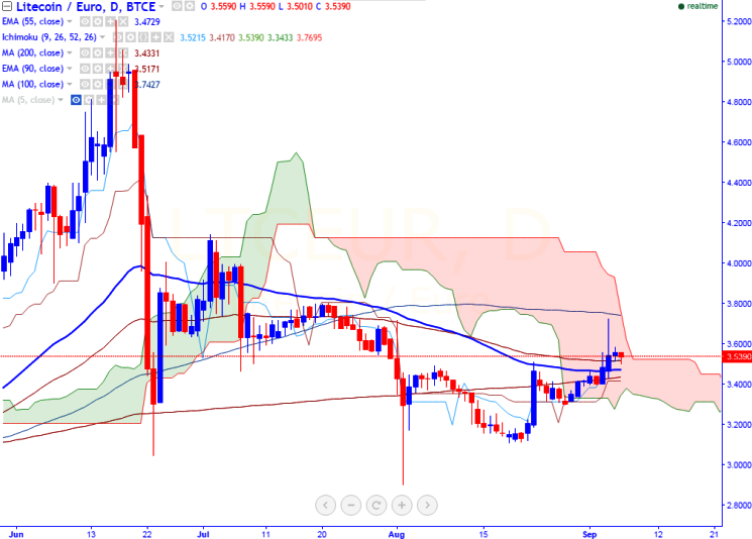
FxWirePro: LTC/EUR trades well above 55-day EMA, jump till 3.75/4 likely
LTC/EUR is seen trading well above on Tuesday. The pair has jumped till 3.725 on Sep 4th 2016 and slightly retreated from that level (BTCE). It is currently trading around 3.54 at the time of writing. Ichimoku analysis o…
By Sujha Sundararanjan
Updated 1 min read
Image from the original EconoTimes article
LTC/EUR is seen trading well above on Tuesday. The pair has jumped till 3.725 on Sep 4th 2016 and slightly retreated from that level (BTCE). It is currently trading around 3.54 at the time of writing.
Ichimoku analysis of daily chart shows:
Tenkan-Sen level: 3.512
Kijun-Sen level: 3.417
Trend reversal level - (90 days MA) - 3.5218
Long- term trend remains to be neutral. In the daily chart, the pair is trading well above 55-day EMA.But it should break above 100-day MA for further bullishness.
Major resistance is around 3.75 (100- day MA) and any break above targets break above targets 4/4.15 (Jul 2nd, 2016 high). Short-term support is seen at 3.43 (200-day MA) and any violation below targets 3.29 (Aug 28th low)/3.134 (61.8% retracement of 2.90 and 3.5130)/2.90 (Aug 2nd low).
The $1.000312 trillion market estimate is dated Sept. 30, 2025; a Senate proposal would direct revaluation proceeds toward Bitcoin purchases and public debt.