


 BTC’s Bear Bounce: Sell the Rally Near $66K as Bears Target $59K–$52K Breakdown
  FxWirePro- Major Crypto levels and bias summary
  FxWirePro- Major Crypto levels and bias summary


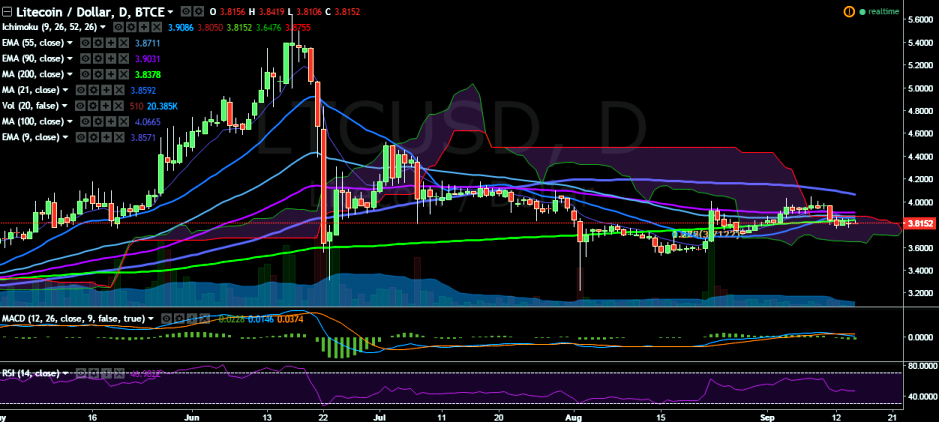
LTC/USD continues to hover around 200-day MA and struggling for a consistent break above this level from past couple of days. It is currently trading at 3.81 levels (BTC-e).
Short-term trend: Bearish
Ichimoku analysis of daily chart:
Tenkan Sen: 3.90
Kijun Sen: 3.80
Trend reversal: 3.90 (90 EMA)
“The pair managed to slightly break above 200-day MA on Wednesday, but facing strong resistance at 3.85 levels (21-day MA), it fell and closed at 3.81 levels. Short-term trend appears weak in the pair and a dip till 3.50 is possible”, FxWirePro said.
On the topside, a break above 3.85 (21 DMA) would target 3.90 (90 EMA)/ 4.05 (September 08 high). Bullishness in the pair could be confirmed only if it breaks above 4.05 levels.
The pair has found near 3.73 (38.2% retracement of 3.22 and 4.05), however, a close below 200 DMA on Wednesday suggests further downtrend. A break below 3.73 would target 3.50 (psychological level)/ 3.22 (August 02 low).

- News

- Economy

- Central Banks
- Investing
- Research
- Roundups
- Digital Currency
- Insights
- Technical Analysis
- Technology
- Business
- Law
- Health
- Nature
- Fintech
- Science
- Topic
- Opinions
- ©Econometrics LLC . All Rights Reserved.
FxWirePro: LTC/USD struggles to close above 200-DMA, good to sell on rallies
Thursday, September 15, 2016 11:31 AM UTC
Editor's Picks


- Market Data
Most Popular


