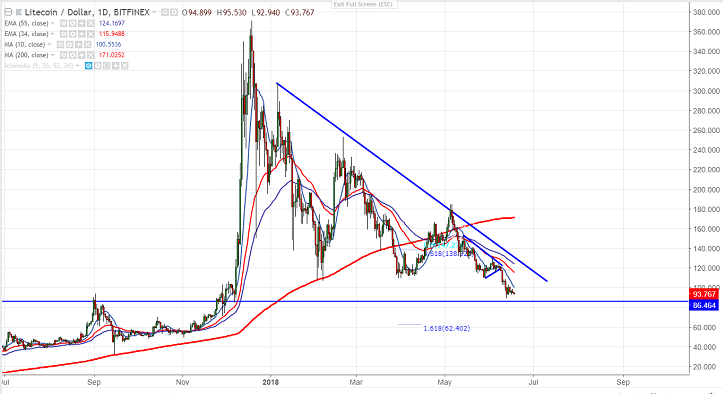
- LTC/USD is declining sharply after hitting temporary top at $184.70 level. The pair declined more than 50% and hits low of $89.14 level. It is currently trading around $93.70. It has declined more than $20 in previous week. The pair is trading weak for second consecutive week. It has declined almost 79% from the all-time high of $370.
- The near term solid resistance is around $116 (20 day MA) and any break above will take the pair to next level till $122 (34- day /$129 (55- day EMA).
- On the lower side, any break below $84 confirms minor weakness and a decline till $75/$70 is possible.
It is good to sell on rallies around $105-$108 with SL around $118 for the TP of $85/$70.


FxWirePro- Major US Indices
FxWirePro: GBP/USD dips lower on negative UK retail sales data
FxWirePro: GBP/USD advances on steady UK GDP growth
FxWirePro: USD/CAD slips as oil rally boosts loonie
FxWirePro: GBP/AUD moves lower on weak UK data
Yen Capitulation Sends GBPJPY to 17-Year Peak – 212.60 Next?
FxWirePro- Major Pair levels and bias summary
FxWirePro- Major Crypto levels and bias summary
FxWirePro: USD/JPY retreats as Japan signals possible FX intervention
FxWirePro:EUR/AUD eases but bullish outlook persists
AUDJPY Bulls Stay in Control: Buy the Dips Above 103.80 Targeting 106
FxWirePro- Woodies Pivot(Major)
FxWirePro- Major Pair levels and bias summary
FxWirePro: USD/ZAR edges higher but bearish outlook persists
FxWirePro: GBP/AUD loses momentum but bullish setup remains
NZDJPY Bulls Charge Ahead: Buying the Dips Above 90 for a Shot at 92 


