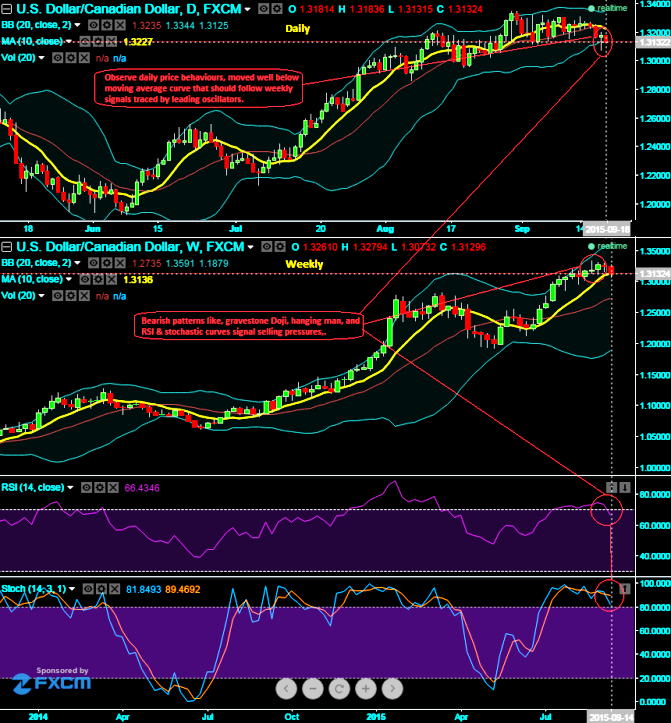
After prolonged bull-run of USDCAD, now looking to reverse and change its direction. Technical charts with all timeframes are tracing out early signs of bearish sentiments. A hanging man pattern candle has formed on daily charts at 1.3181 levels which is well below moving average curve, this can be utilized for long term hedging frameworks, while leading RSI oscillator is converging downwards with price slumps and %D crossover on slow stochastic curve signify the price directions towards downside.
But our analysis has never stopped there, when we plotted weekly charts we arrive with gravestone doji at 1.3196 the peaks of previous uptrend, this pattern on uptrend implies trend reversal attitude.
In conjunction with this bearish pattern, we also observed divergence to the previous uptrend on RSI oscillator above 70 levels that signals overbought pressures. %D crossing over above 80 levels on stochastic curves to substantiate this bearish stance.
Currently, the pair is lingering at 1.3141, RSI curve is trending at 67.3529 heading towards south, while %D line 89.9453 and %K line at 83.2857. Hence, we would see near targets at around 1.2960 areas and can even extend upto 1.2723 levels in near terms with a strict stop loss at 1.3326 levels.