


 Major FX Action Bias & US Market Sentiment: NZD/USD (Extremely Bullish) & AUD/USD (Bullish) Watchlist
  NZDJPY Bullish Rebound: Buy Dips as EMAs Align for 97 Target
  FxWirePro: GBP/NZD remains weak, eyes 38.2%fib support
  FxWirePro: GBP/AUD drifts lower after BOE rate decision
  FxWirePro- Major Pair levels and bias summary
  FxWirePro- Woodies pivot (Major)
  JPY Currency Meter Signals: NZDJPY Bullish (+25) vs CHFJPY (-100) – These Pairs Could Move Next
  FxWirePro- Woodies pivot (Major)
  FxWirePro: EUR/ AUD dips below 1.6400 level, focus on near term support
  FxWirePro- Major Crypto levels and bias summary
  US Magnificent 7 Stocks Trend Score: Amazon & Microsoft Hit Extreme Bullish (+100) as Meta Drops to -100 — Key Resistance & Support Watchlist
  US Magnificent 7 Stocks Trend Score: Amazon & Microsoft Hit Extreme Bullish (+100) as Meta Drops to -100 — Key Resistance & Support Watchlist
  Nikkei Surges Past 65,000 on Suspected Yen Weakness: Tech Giants Like Advantest and NEC Lead Explosive Gains
  AUDJPY Volatile After Massive Sell-Off: Sell Rallies at 113, Targeting 110 as Bearish Momentum Surges
  FxWirePro: USD/ZAR gains as stronger dollar outweighs upbeat South Africa's trade surplus


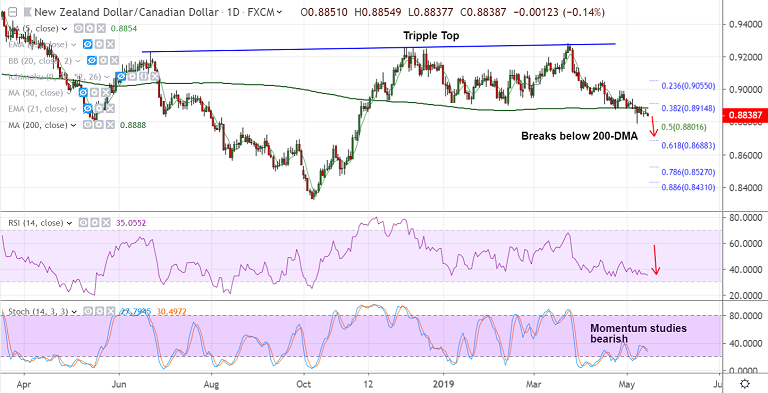
NZD/CAD chart - Trading View
- NZD/CAD is extending downside after 'Tripple Top' formation on the daily charts.
- Price action has slipped below 200-DMA and we see scope for further weakness.
- Antipodeans depressed on dismal China data dump and escalating Sino-US trade dispute.
- China consumer spending rose 7.2% in April, missing expectations at 8.6%. Meanwhile, industrial production rose 5.4% in April, missing expectations for a print of 6.5%.
- Momentum studies for the pair are bearish, Stochs and RSI are sharply lower.
- Recovery attempts capped at 200-DMA. Price action has dipped into weekly cloud.
- Next major bear target lies at 0.8688 (61.8% Fib). Retrace above 200-DMA could see upside resumption.
Support levels - 0.8801 (50% Fib), 0.8688 (61.8% Fib), 0.8588 (Aug 30 low)
Resistance levels - 0.8853 (5-DMA), 0.8888 (200-DMA), 0.8915 (38.2% Fib)
For details on FxWirePro's Currency Strength Index, visit http://www.fxwirepro.com/currencyindex.


