


 Urban studies: Doing research when every city is different
  Geopolitical Shocks That Could Reshape Financial Markets in 2025
  Energy Sector Outlook 2025: AI's Role and Market Dynamics
  FxWirePro: GBP/AUD sustains gains as uptrend remains strong
  S&P 500 Relies on Tech for Growth in Q4 2024, Says Barclays
  Gold Prices Slide as Rate Cut Prospects Diminish; Copper Gains on China Stimulus Hopes
  FxWirePro: AUD/USD eases after Australian mixed CPI data
  Bitcoin Sheds $491M in ETF Outflows and Retreats Below $64K; Sellers Reload for $50K
  Oil Prices Dip Slightly Amid Focus on Russian Sanctions and U.S. Inflation Data
  FxWirePro: USD/ZAR remains buoyant, looks to extend gains
  FxWirePro: GBP/NZD gaining momentum for a move towards 2.3100 level
  UBS Projects Mixed Market Outlook for 2025 Amid Trump Policy Uncertainty
  2025 Market Outlook: Key January Events to Watch
  U.S. Stocks vs. Bonds: Are Diverging Valuations Signaling a Shift?
  Goldman Predicts 50% Odds of 10% U.S. Tariff on Copper by Q1 Close
  China’s Growth Faces Structural Challenges Amid Doubts Over Data
  NZDJPY Bears Reload as 92 Resistance Caps Bounce; Sell-on-Rallies Eyed Toward 90


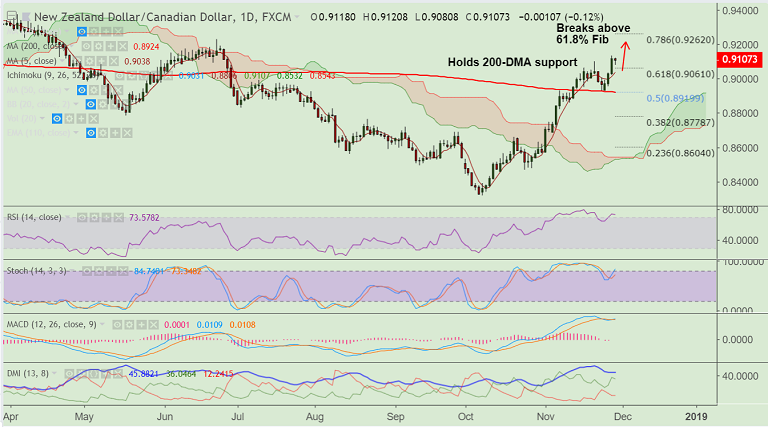
NZD/CAD chart on Trading View used for analysis
- NZD/CAD has hit 5-month highs at 0.9134 on Wednesday's trade, bias higher.
- The pair is extedning a bounce off strong support at 200-DMA and has broken above 61.8% Fib retracement.
- Price action has broken above stiff resistance at 200W SMA at 0.9077, raising scope for further gains.
- Momentum strongly bullish on the daily charts. Technical studies are turning bullish on weekly charts.
- Impressive upside economic surprises from New Zealand, such as jobs/CPI and GDP likely to support the kiwi.
- Next bull target lies at 0.9227, while we see weakness till 0.88 on break below 200-DMA.
Support levels - 0.9077 (200W SMA), 0.9061 (61.8% Fib), 0.9039 (5-DMA)
Resistance levels - 0.9227 (June 2018 high), 0.9262 (78.6% Fib)
For details on FxWirePro's Currency Strength Index, visit http://www.fxwirepro.com/currencyindex.


