


- NZD/CAD resumes downside after brief consolidation, trades 0.26% lower on the day.
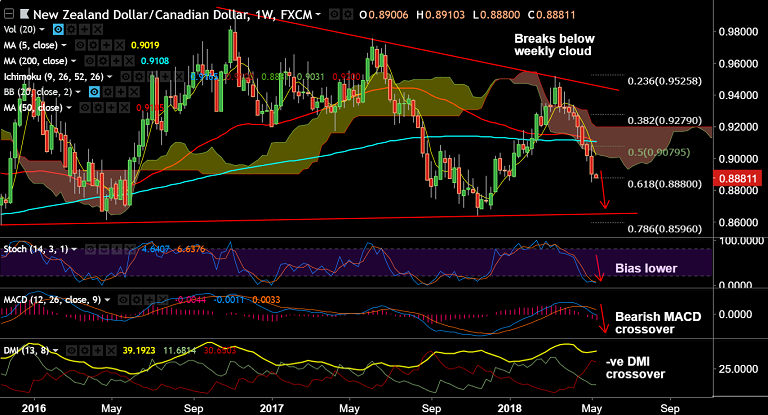
- Price action below 200-DMA at 0.9042, bias lower.
- Momentum studies bearish, MACD well below zero levels. RSI well below 30 levels and we see -ve DMI dominance.
- On weekly charts we see bearish MACD crossover and -ve DMI crossover.
- That said, we see bullish divergence on Stochs and RSI on the daily charts which calls for caution.
- The pair is trading in a falling Triangle pattern and break below 61.8% Fib raises scope for further weakness.
Support levels - 0.8850 (May 10 low), 0.8740 (Sept 12 low), 0.87, 0.8663 (trendline)
Resistance levels - 0.89, 0.8934 (5-DMA), 0.90, 0.9042 (200-DMA)
Call update: Our previous call (https://www.econotimes.com/FxWirePro-NZD-CAD-Trade-Idea-1306668) is progressing well.
Recommendation: Stay short for targets.
FxWirePro Currency Strength Index: FxWirePro's Hourly NZD Spot Index was at -151.678 (Bearish), while Hourly CAD Spot Index was at 53.7424 (Neutral) at 0645 GMT. For more details on FxWirePro's Currency Strength Index, visit http://www.fxwirepro.com/currencyindex.
FxWirePro launches Absolute Return Managed Program. For more details, visit http://www.fxwirepro.com/invest.


