


Refer NZD/CHF chart on Trading View
- NZD/CHF is trading a narrow range on the day, with a day's high at 0.6552 and low at 0.6516.
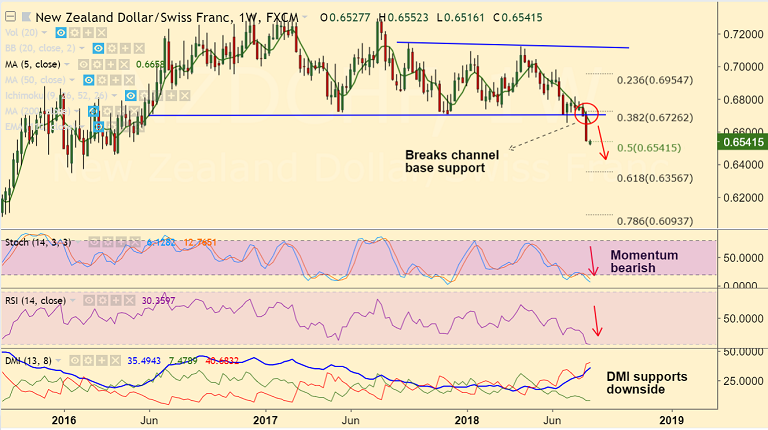
- The pair is likely consolidating breakout of Channel pattern and Technical indicators are still bearish suggesting further downside.
- Broad-market risk aversion on growing political crisis in Turkey and fears of contagion to EM markets is likely to keep the kiwi suppressed.
- Momentum studies on weekly charts are highly bearish. RSI is at 30 levels and DMI supports downside.
- Price action hovers around 50% Fib and finds next major support at 61.8% Fib at 0.6356.
- Retrace into channel could invalidate the bearish bias.
Support levels - 0.6460 (Apr 2016 low), 0.6356 (61.8% Fib)
Resistance levels - 0.6658 (5W SMA), 0.6726 (38.2% Fib)
FxWirePro Currency Strength Index: FxWirePro's Hourly NZD Spot Index was at -32.9275 (Neutral), while Hourly CHF Spot Index was at 27.0931 (Neutral) at 1030 GMT. For more details on FxWirePro's Currency Strength Index, visit http://www.fxwirepro.com/currencyindex.


