


 FxWirePro:USD/JPY climbs back above 160.00 after BOJ rate decision
  FxWirePro: USD/ CNY hits one-month low,scope for futher downside
  FxWirePro- Major Pair levels and bias summary
  AUDJPY Volatile After Massive Sell-Off: Sell Rallies at 113, Targeting 110 as Bearish Momentum Surges
  FxWirePro: USD/ZAR gains as stronger dollar outweighs upbeat South Africa's trade surplus
  FxWirePro: NZD/USD consolidates overnight gains, but loses momentum
  FxWirePro- Major Crypto levels and bias summary
  FxWirePro: USD/JPY edges higher as focus shifts to BOJ decision
  Major FX Action Bias & US Market Sentiment: NZD/USD (Extremely Bullish) & AUD/USD (Bullish) Watchlist
  US Magnificent 7 Stocks Trend Score: Amazon & Microsoft Hit Extreme Bullish (+100) as Meta Drops to -100 — Key Resistance & Support Watchlist
  JPY Currency Meter Signals: NZDJPY Bullish (+25) vs CHFJPY (-100) – These Pairs Could Move Next
  NZDJPY Bullish Rebound: Buy Dips as EMAs Align for 97 Target
  FxWirePro: USD/CAD retreats after Canada posts stronger-than-expected GDP growth
  FxWirePro: GBP/USD rises as soft US data pressures dollar
  FxWirePro: USD/CNY dips to hit three year low,scope for further downside
  FxWirePro: GBP/NZD remains weak, eyes 38.2%fib support


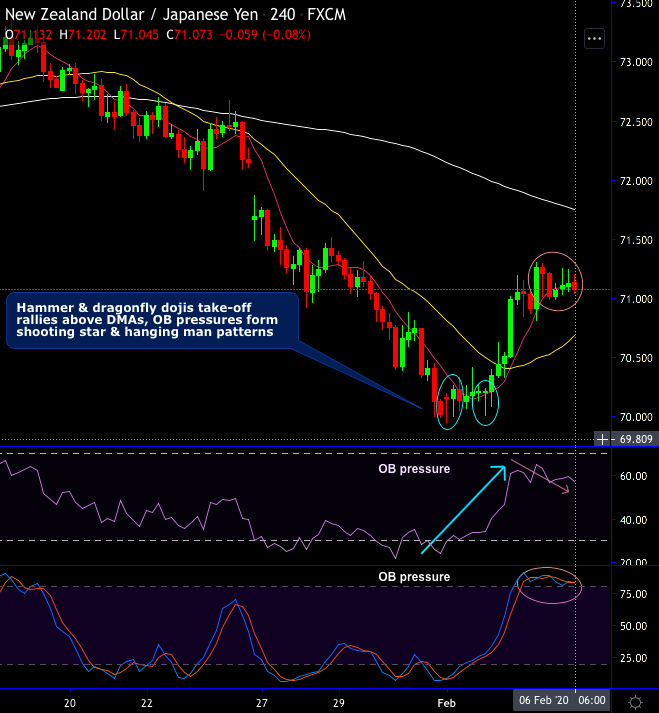
Although NZDJPY shows interim rallies upon hammer and dragonfly doji patterns 70.229 and 70.157 levels respectively, these upswings seem momentary as the overbought pressures form hanging man at 71.211 and back-to-back shooting star patterns at 71.104 and 71.132 levels. These bearish patterns coupled with overbought pressures signal weakness at this juncture.
The decline in January could extend below 70.00 if the coronavirus epidemic persists. Event risk during the next week comes from wage data and a leading index.
The shooting star, hanging man and bearish engulfing patterns pop-up quite often on both intraday as well as long-term charts to remind us the major downtrend. While MACD & DMAs are indecisive but bearish bias.
On a broader perspective, to substantiate the above standpoint, the major downtrend was sliding through the falling wedge (refer monthly chart) although it took support at wedge baseline, the interim rallies were capped at 21EMAs.
The bearish engulfing pattern has occurred at 70.015 levels that intensifies the major downtrend below EMAs, this bearish pattern nudges price below EMAs. Overall, both minor and major trends seem to show renewed weakness.
Hence, shorts in the mid-month futures have been advocated with a view of arresting further downside risks.
Alternatively, one can also buy tunnel options spreads with upper strikes at 71.271 and lower strikes at 70.815 levels on the trading grounds (spot reference: 71.104 levels).


