


 FxWirePro: GBP/NZD up trend gains some momentum but hurdles ahead
  FxWirePro: USD/JPY holding bid into weekend
  FxWirePro: EUR/CAD gains ground on prospects of resumed energy flows
  FxWirePro- Major European Indices
  FxWirePro: GBP/USD biased higher but rally currently stretched
  FxWirePro: AUD/USD retreats slightly but trend is still bullish
  FxWirePro: GBP/NZD down trend loses steam, remains on bearish path
  Energy Surge Ignites US Inflation: USDCHF Eyes Support Amid Dollar Sell-Off
  FxWirePro: USD/ZAR edges lower ,investors remain on edge
  NZDJPY Bulls Charge Toward 95.00: Safe-Haven Exodus Drives Kiwi Rally
  FxWirePro: USD/CAD extends decline on broad dollar weakness
  FxWirePro: USD/CNY neutral in the near-term, scope for downward resumption
  Ethereum Consolidates: Bullish Technicals Point to a Potential $3,000 Breakout
  FxWirePro- Major Crypto levels and bias summary
  FxWirePro:NZD/USD uptrend loses momentum but bullish setup remains
  FxWirePro- Woodies Pivot(Major)
  FxWirePro- Major Pair levels and bias summary


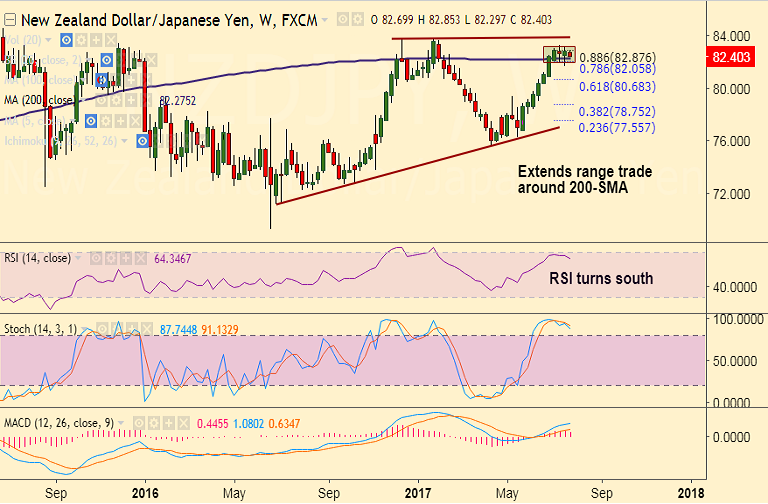
- NZD/JPY is extending range trade above weekly 200-SMA, we see weakness on break below.
- We have evidenced a 'Bearish Bat Pattern' on daily charts which raises scope for downside in the pair.
- Technical indicators support downside in the pair. MACD has shown a bearish crossover and Stochs are biased lower.
- Doji and spinning top formations on weekly charts add to downside bias. RSI on the weeklies has also turned south.
Support levels - 82.27 (Weekly 200-SMA), 81.62 (23.6% Fib retrace of 76.270 to 83.272 rally), 80.66 (Feb 9th low)
Resistance levels - 82.52 (5-DMA), 83, 83.27 (July 13 high)
Recommendation: Watch out for break below weekly 200-SMA to go short.
FxWirePro Currency Strength Index: FxWirePro's Hourly NZD Spot Index was at 99.6675 (Bullish), while Hourly JPY Spot Index was at 122.164 (Bullish) at 1130 GMT. For more details on FxWirePro's Currency Strength Index, visit http://www.fxwirepro.com/currencyindex.
FxWirePro launches Absolute Return Managed Program. For more details, visit http://www.fxwirepro.com/invest


