


 Bitcoin Sheds $491M in ETF Outflows and Retreats Below $64K; Sellers Reload for $50K
  FxWirePro- Major Crypto levels and bias summary
  US Gas Market Poised for Supercycle: Bernstein Analysts
  FxWirePro- Woodies pivot (Major)
  Bank of America Posts Strong Q4 2024 Results, Shares Rise
  Moldova Criticizes Russia Amid Transdniestria Energy Crisis
  FxWirePro- Woodies pivot (Major)
  US Futures Rise as Investors Eye Earnings, Inflation Data, and Wildfire Impacts
  European Stocks Rally on Chinese Growth and Mining Merger Speculation
  NZDJPY Bears Reload as 92 Resistance Caps Bounce; Sell-on-Rallies Eyed Toward 90
  ETH Bounces as Shorts Cover, Yet ETF Bleed Warns $1,850 Resistance Won’t Break
  Stock Futures Dip as Investors Await Key Payrolls Data
  EURUSD Bullish Momentum: Trading Above 800, 365 EMAs with Positive CCI on 5-Min Chart
  FxWirePro- Major Pair levels and bias summary
  FxWirePro:NZD/USD rout continues without relief
  FxWirePro- Major Pair levels and bias summary


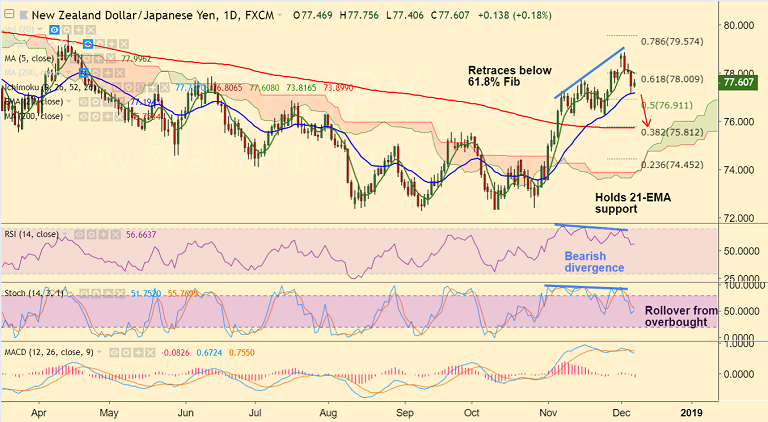
NZD/JPY chart on Trading View used for analysis
- NZD/JPY trades 0.17% higher on the day at 77.59 at the time of writing.
- The pair has held support at 21-EMA on Thursday's trade and edged higher.
- Break below 21-EMA will see weakness. Scope for dip till 200-DMA at 75.75.
- Technical studies on weekly charts is biased higher. But we see some weakness on the dailies.
- Price action has broken below 5-DMA and 5-DMA has turned. RSI and Stochs are biased lower after rollover from overbought levels.
- We see bearish divergence on RSI and Stochs which adds to the bearish bias.
Support levels - 77.19 (21-EMA), 76.26 (Nov 26 low), 75.75 (200-DMA)
Resistance levels - 78 (5-DMA), 78.86 (Dec 4 high), 79
Recommendation: Good to go short on break below 21-EMA, SL: 78, target 76.30/ 76/ 75.75
For details on FxWirePro's Currency Strength Index, visit http://www.fxwirepro.com/currencyindex.


