


 Nikkei Surges Past 65,000 on Suspected Yen Weakness: Tech Giants Like Advantest and NEC Lead Explosive Gains
  FxWirePro- Woodies pivot (Major)
  US Magnificent 7 Stocks Trend Score: Amazon & Microsoft Hit Extreme Bullish (+100) as Meta Drops to -100 — Key Resistance & Support Watchlist
  FxWirePro: GBP/NZD remains weak, eyes 38.2%fib support
  FxWirePro: GBP/AUD drifts lower after BOE rate decision
  NZDJPY Bullish Rebound: Buy Dips as EMAs Align for 97 Target
  Major European Indices Score Extremely Bullish: DAX Eyes 26000, CAC Targets 8600, FTSE100 at 11000 – Key Levels to Watch
  FxWirePro- Woodies pivot (Major)
  FxWirePro- Major Crypto levels and bias summary
  FxWirePro: USD/ZAR gains as stronger dollar outweighs upbeat South Africa's trade surplus
  NZDJPY Retreats on Yen Strength – Bearish Setup Targets 90 After Hitting 92.75 Low
  AUDJPY Volatile After Massive Sell-Off: Sell Rallies at 113, Targeting 110 as Bearish Momentum Surges
  FxWirePro: USD/CAD retreats after Canada posts stronger-than-expected GDP growth
  AUD/JPY Slips Below 112 as BOJ Intervention Sparks Bearish Momentum: Sell the Rallies
  FxWirePro: GBP/NZD remains weak, eyes 38.2%fib support


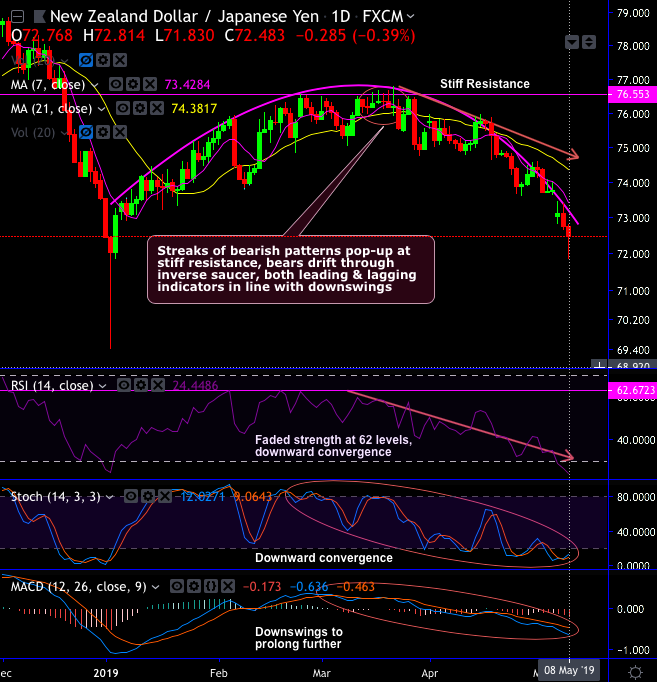
NZDJPY forms flurry of bearish patterns at the stiff resistance of 76.553 levels, consequently, bears drift through inverse saucer which is bearish in nature.
Back-to-back shooting stars and gravestone doji have occurred to signal weakness of this pair (refer circular area at the top of the inverse saucer on the daily chart). Ever since then, bears constantly plummet prices below DMAs.
While both leading and lagging indicators are in line with downswings. RSI and fast stochastic curves show downward convergence to the prevailing price dips that indicate intensified selling momentum.
On a broader perspective, to substantiate the above standpoint, the major downtrend slides through the falling wedge (refer monthly chart).
The bearish engulfing has occurred at 73.545 levels that intensifies major downtrend below EMAs, this bearish pattern nudges price below EMAs.
For now, more slumps on cards as both lagging indicators signal bearish trend continuation & RSI indicated faded strength at 56 levels and bearish bias.
Hence, we have already advocated maintaining shorts in the mid-month futures with a view of arresting the downside risks. As RBNZ has cut OCR rates by 25 bps, we could foresee more slumps on the cards. Hence, we wish to uphold the same short hedge strategy. Alternatively, one can also buy tunnel options spreads with upper strikes at 72.815 and lower strikes at 71.830 levels on intraday trading grounds.
Currency Strength Index: FxWirePro's hourly NZD spot index is inching towards -21 levels (which is mildly bearish), JPY at 53 (bullish), while articulating (at 05:39 GMT).
For more details on the index, please refer below weblink: http://www.fxwirepro.com/currencyindex


