


 FxWirePro: NZD/USD consolidates overnight gains, but loses momentum
  NZDJPY Retreats on Yen Strength – Bearish Setup Targets 90 After Hitting 92.75 Low
  FxWirePro: GBP/NZD remains weak, eyes 38.2%fib support
  FxWirePro- Major Pair levels and bias summary
  FxWirePro:USD/JPY climbs back above 160.00 after BOJ rate decision
  FxWirePro- Major Pair levels and bias summary
  FxWirePro: GBP/USD rises as soft US data pressures dollar
  FxWirePro: USD/ZAR gains as stronger dollar outweighs upbeat South Africa's trade surplus
  AUD/JPY Slips Below 112 as BOJ Intervention Sparks Bearish Momentum: Sell the Rallies
  FxWirePro: USD/CAD retreats after Canada posts stronger-than-expected GDP growth
  Major FX Action Bias & US Market Sentiment: NZD/USD (Extremely Bullish) & AUD/USD (Bullish) Watchlist
  FxWirePro- Major Crypto levels and bias summary
  US Magnificent 7 Stocks Trend Score: Amazon & Microsoft Hit Extreme Bullish (+100) as Meta Drops to -100 — Key Resistance & Support Watchlist
  FxWirePro- Woodies pivot (Major)
  FxWirePro- Major Crypto levels and bias summary
  AUDJPY Volatile After Massive Sell-Off: Sell Rallies at 113, Targeting 110 as Bearish Momentum Surges
  US Magnificent 7 Stocks Trend Score: Amazon & Microsoft Hit Extreme Bullish (+100) as Meta Drops to -100 — Key Resistance & Support Watchlist


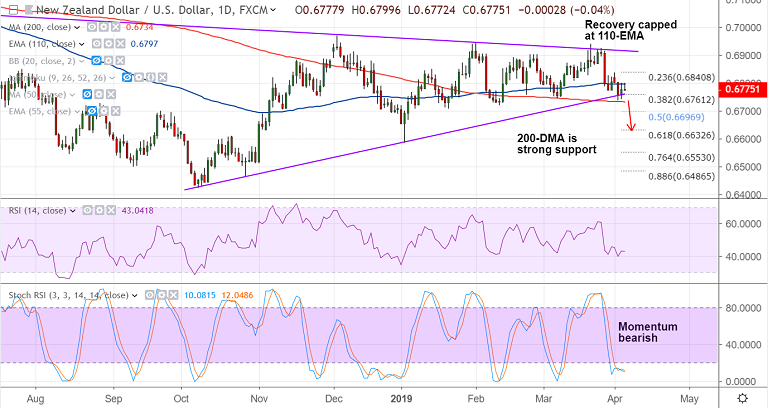
NZD/USD chart - Trading View
Candlestick Pattern: Inverted Hammer
Chart Pattern: Symmetric Triangle
Technical Analysis:
- NZD/USD rejected at 110-EMA resistance
- RSI below 50, bias bearish
- Stochs are at oversold levels, but no signs of reversal evident
- MACD supports weakness, -ve DMI is dominant
Major Support - 0.6761 (38.2% Fib), 0.6734 (200-DMA)
Major Resistance - 0.6797 (110-EMA), 0.6840 (23.6% Fib)
Currency Forecast: Scope for test of 0.6761/ 0.6735
For details on FxWirePro's Currency Strength Index, visit http://www.fxwirepro.com/currencyindex.

- News

- Economy

- Central Banks
- Investing
- Research
- Roundups
- Digital Currency
- Insights
- Technical Analysis
- Technology
- Business
- Law
- Health
- Nature
- Fintech
- Science
- Topic
- Opinions
- ©Econometrics LLC . All Rights Reserved.
FxWirePro: NZD/USD Daily Outlook
Thursday, April 4, 2019 10:05 AM UTC
Editor's Picks


- Market Data
Most Popular


