
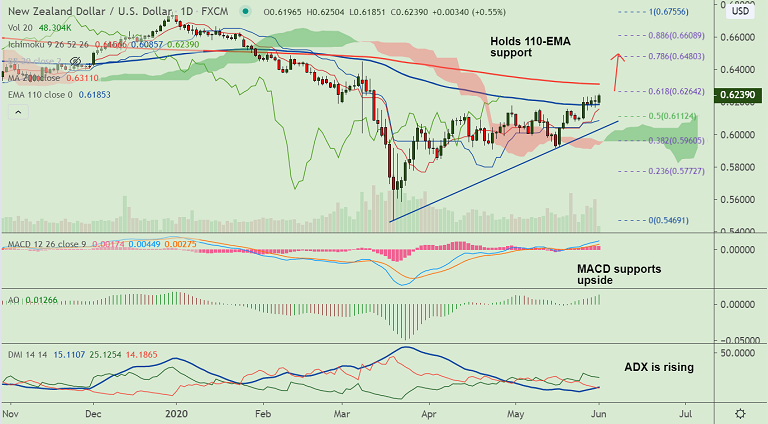
NZD/USD chart - Trading View
Technical Analysis: Bias Bullish
GMMA Indicator
- Major trend is turning bullish, while minor trend is strongly bullish
- GMMA keeps scope for further gains
Ichimoku Analysis
- Price action is extending cloud break out
- Chikou Span is biased higher and signals upside continuation
Oscillators
- Oscillators are bullishly aligned, RSI is above 60 which supports upside momentum
- Stochastics show bullish momentum, are at overbought levels, but do not show any signs of reversal
Bollinger Bands
- Bollinger bands are widening on the daily charts
- Rising volatility with bullish momentum could carry the pair higher
Major Support Levels: 0.6207 (5-DMA), 0.6185 (110-EMA), 0.6117 (21-EMA)
Major Resistance Levels: 0.6264 (61.8% Fib), 0.6311 (200-DMA), 0.6355 (55W EMA)
Summary: Broad-based US dollar weakness and upbeat China data keeps antipodeans supported. Technical bias is also bullish. We see scope for further gains. Bulls target 200-DMA at 0.6311. Breakout at 200-DMA will propel the pair high.


