


Refer NZD/USD chart on Trading View
- NZD/USD hits fresh multi-year lows at 0.6561, momentum still bearish.
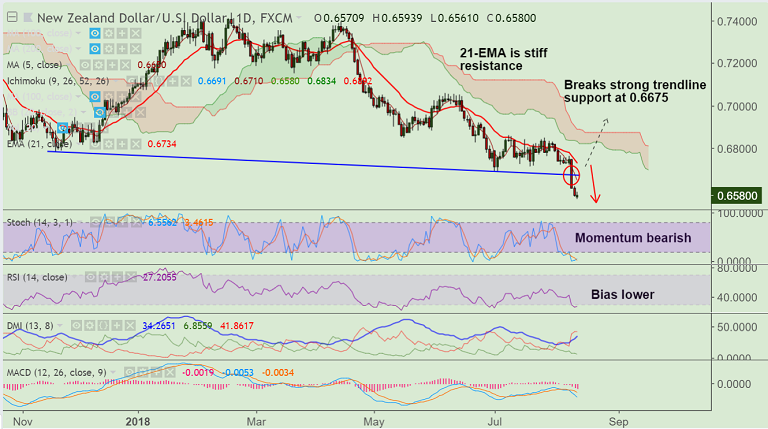
- The major has broken strong trendline support at 0.6675 in last week's trade and we see scope for further weakness.
- Broad-market risk aversion on growing political crisis in Turkey and fears of contagion to EM markets is likely to keep the kiwi supressed.
- Technical indicators on daily charts are biased lower. Momentum with the bears.
- MACD and DMI also support further downside in the pair. Price action is well below daily cloud and major moving averages.
- Next major bear target lies at 78.6% Fib at 0.6488. Violation there could see further weakness.
- On the flipside, 5-DMA is immediate resistance, break above could see minor upside. Bearish invalidation only above 21-EMA.
Support levels - 0.6488 (78.6% Fib), 0.64, 0.6428 (Nov 2015 low)
Resistance levels - 0.66, 0.6650 (5-DMA), 0.6733 (21-EMA)
FxWirePro Currency Strength Index: FxWirePro's Hourly NZD Spot Index was at -77.0784 (Neutral), while Hourly USD Spot Index was at 12.397 (Neutral) at 0745 GMT. For more details on FxWirePro's Currency Strength Index, visit http://www.fxwirepro.com/currencyindex.


